AI Adoption Metrics That Actually Reflect Business Impact
Most organizations track AI activity instead of impact, mistaking tool usage for business value.

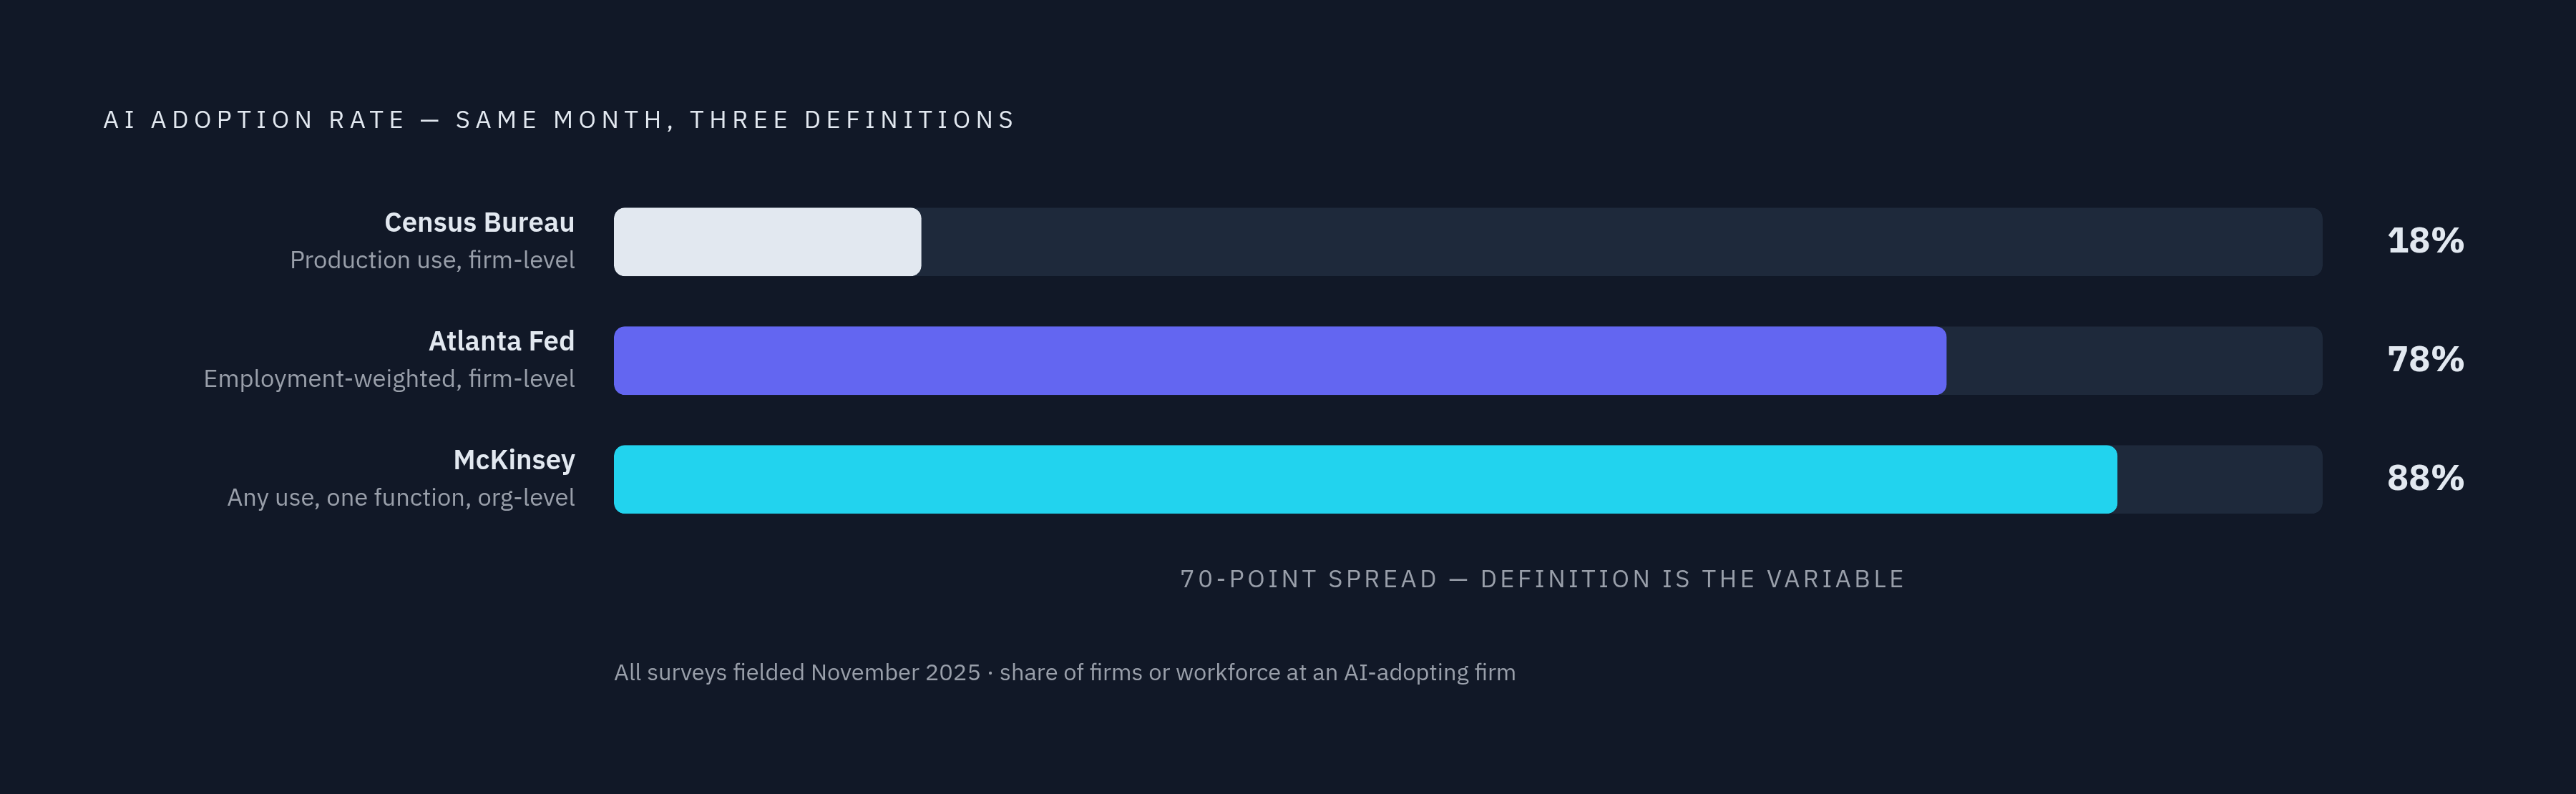
Every executive who has approved an AI budget should sit with this: the Census Bureau's Business Trends and Outlook Survey, using a strict production-use definition, found 18% of U.S. firms had adopted AI as of November 2025. The Atlanta Fed's Survey of Business Uncertainty, weighted by employment, found 78% of the U.S. labor force works at a firm that has adopted AI, measured the same month. McKinsey's 2025 State of AI report, across nearly 2,000 organizations, found 88% use AI in at least one business function.
These aren't contradictions. They're measurement choices. A small business with two employees and no AI tools drags the Census number down. A large employer with one AI-enabled HR function lifts the McKinsey number up. What you count determines what you see, and most organizations, when they turn from national surveys to internal dashboards, repeat exactly the same definitional error. They reach for the most legible unit available: seats activated, licenses provisioned, tools deployed. Technically accurate. Strategically useless.
The business results tell the rest of the story. PwC's 2026 CEO Survey found 56% of CEOs report neither increased revenue nor decreased costs from AI in the last twelve months. Only 12% report achieving both. That's not a technology failure. It's a deployment and measurement failure. The majority of organizations running AI at scale are tracking something other than whether it helps the business, and they're funding continued expansion on the basis of that incomplete signal.
The abandonment data makes this concrete. S&P Global found the share of companies abandoning most of their AI projects jumped from 17% to 42% in 2025, citing total cost and unclear value as the primary reasons. IBM's CEO research found roughly a quarter of AI initiatives deliver expected ROI, and only 16% have scaled enterprise-wide. Organizations are measuring pilot-level activity and calling it enterprise-level progress.
Deloitte's 2025 survey found 85% of organizations increased AI investment in the past twelve months, and 91% plan to increase it again, despite the ROI ambiguity. Investment accelerates while impact evidence lags. That disconnect is only sustainable if the metrics used to justify continued spending don't require demonstrated outcomes. For most organizations, they don't.
Why activity metrics feel like progress while proving nothing
The standard vanity metric stack looks like this: adoption rate expressed as percentage of users who logged in, volume measured in prompts submitted or tokens consumed, technical performance tracked as latency and uptime, user sentiment captured through periodic surveys. Every one of these metrics is legible, reportable, and improvable without a single business outcome changing.
Organizations land here for three compounding reasons: they measure outputs instead of outcomes, they set no pre-rollout baseline (making before-and-after comparison impossible), and they rely on self-reported data rather than system-level telemetry. Each failure amplifies the others, and together they create a feedback loop that feels like rigor.
The self-report problem is more corrosive than it sounds. A randomized trial conducted by METR found experienced open-source developers were 19% slower with early-2025 AI tools on real-world issues, despite believing they were 20% faster. Perception and performance moved in opposite directions. If your adoption metrics depend on employees reporting their own productivity gains, you're measuring confidence, not capability. Confident and slower is still slower.
Consumption-based pricing makes this worse. When organizations are billed per token, token volume becomes a trackable metric with an implicit incentive attached. Maximizing model usage and maximizing business impact are not the same objective, but they're easy to conflate when the billing statement arrives. A team running more prompts looks more engaged. It is doing less useful work.
Here is a dynamic I've watched play out more than once: organizations optimize pilot-program metrics so intensely that the metrics become the goal. The pilot succeeds on its own terms, indefinitely, while the business never moves. This isn't cynicism. It's what happens when you apply sustained organizational pressure to any proxy measure. It stops correlating with the thing it was meant to represent. Activity metrics were efficient proxies for deployment effort. They were never designed to represent business value, and treating them as though they were is the core error.
What organizations that see real financial impact do differently
McKinsey's 2025 State of AI data defines high performers as organizations attributing 5% or more of EBIT impact to AI. Approximately 6% of respondents qualify. Thirty-nine percent report any EBIT impact at the enterprise level. The rest sit somewhere between no measurable impact and active project abandonment.
What separates the high performers isn't which tools they chose. Fifty-five percent of them say they fundamentally reworked processes when deploying AI, nearly three times the rate of other firms. They are also 3.6 times more likely to say they intend to use AI for transformative change rather than incremental efficiency. While 80% of all respondents cite efficiency as an objective, high performers explicitly add revenue growth and innovation. The ambition of the objective shapes the rigor of the measurement. If you're only trying to save a little time, you don't need precise outcome metrics. If you're trying to move EBIT, you do, and that necessity forces the kind of specificity most organizations skip.
BCG's 2025 data shows 60% of organizations generate no material value from AI despite their investments, while only 5% create substantial value at scale. That 5% shows 1.7 times the revenue growth and 3.6 times the three-year Total Shareholder Return of the laggards. Gartner's 2025 survey of nearly 2,000 managers found that organizations redesigning work processes with AI are twice as likely to exceed revenue goals.
High performers aren't just measuring differently. They're deploying differently, and different deployment creates outcomes that are actually measurable. When you restructure a workflow, you have a before state and an after state; you can attribute the delta. When you add a tool to an existing workflow without changing it, you have activity. Measuring EBIT contribution by function, the standard McKinsey applies, works because it demands specificity: which function, which workflow, which financial line. That specificity is only achievable when the deployment was specific enough to generate it.
The three tiers of metrics worth tracking, and what each one can and cannot tell you
Tier 1: Engagement
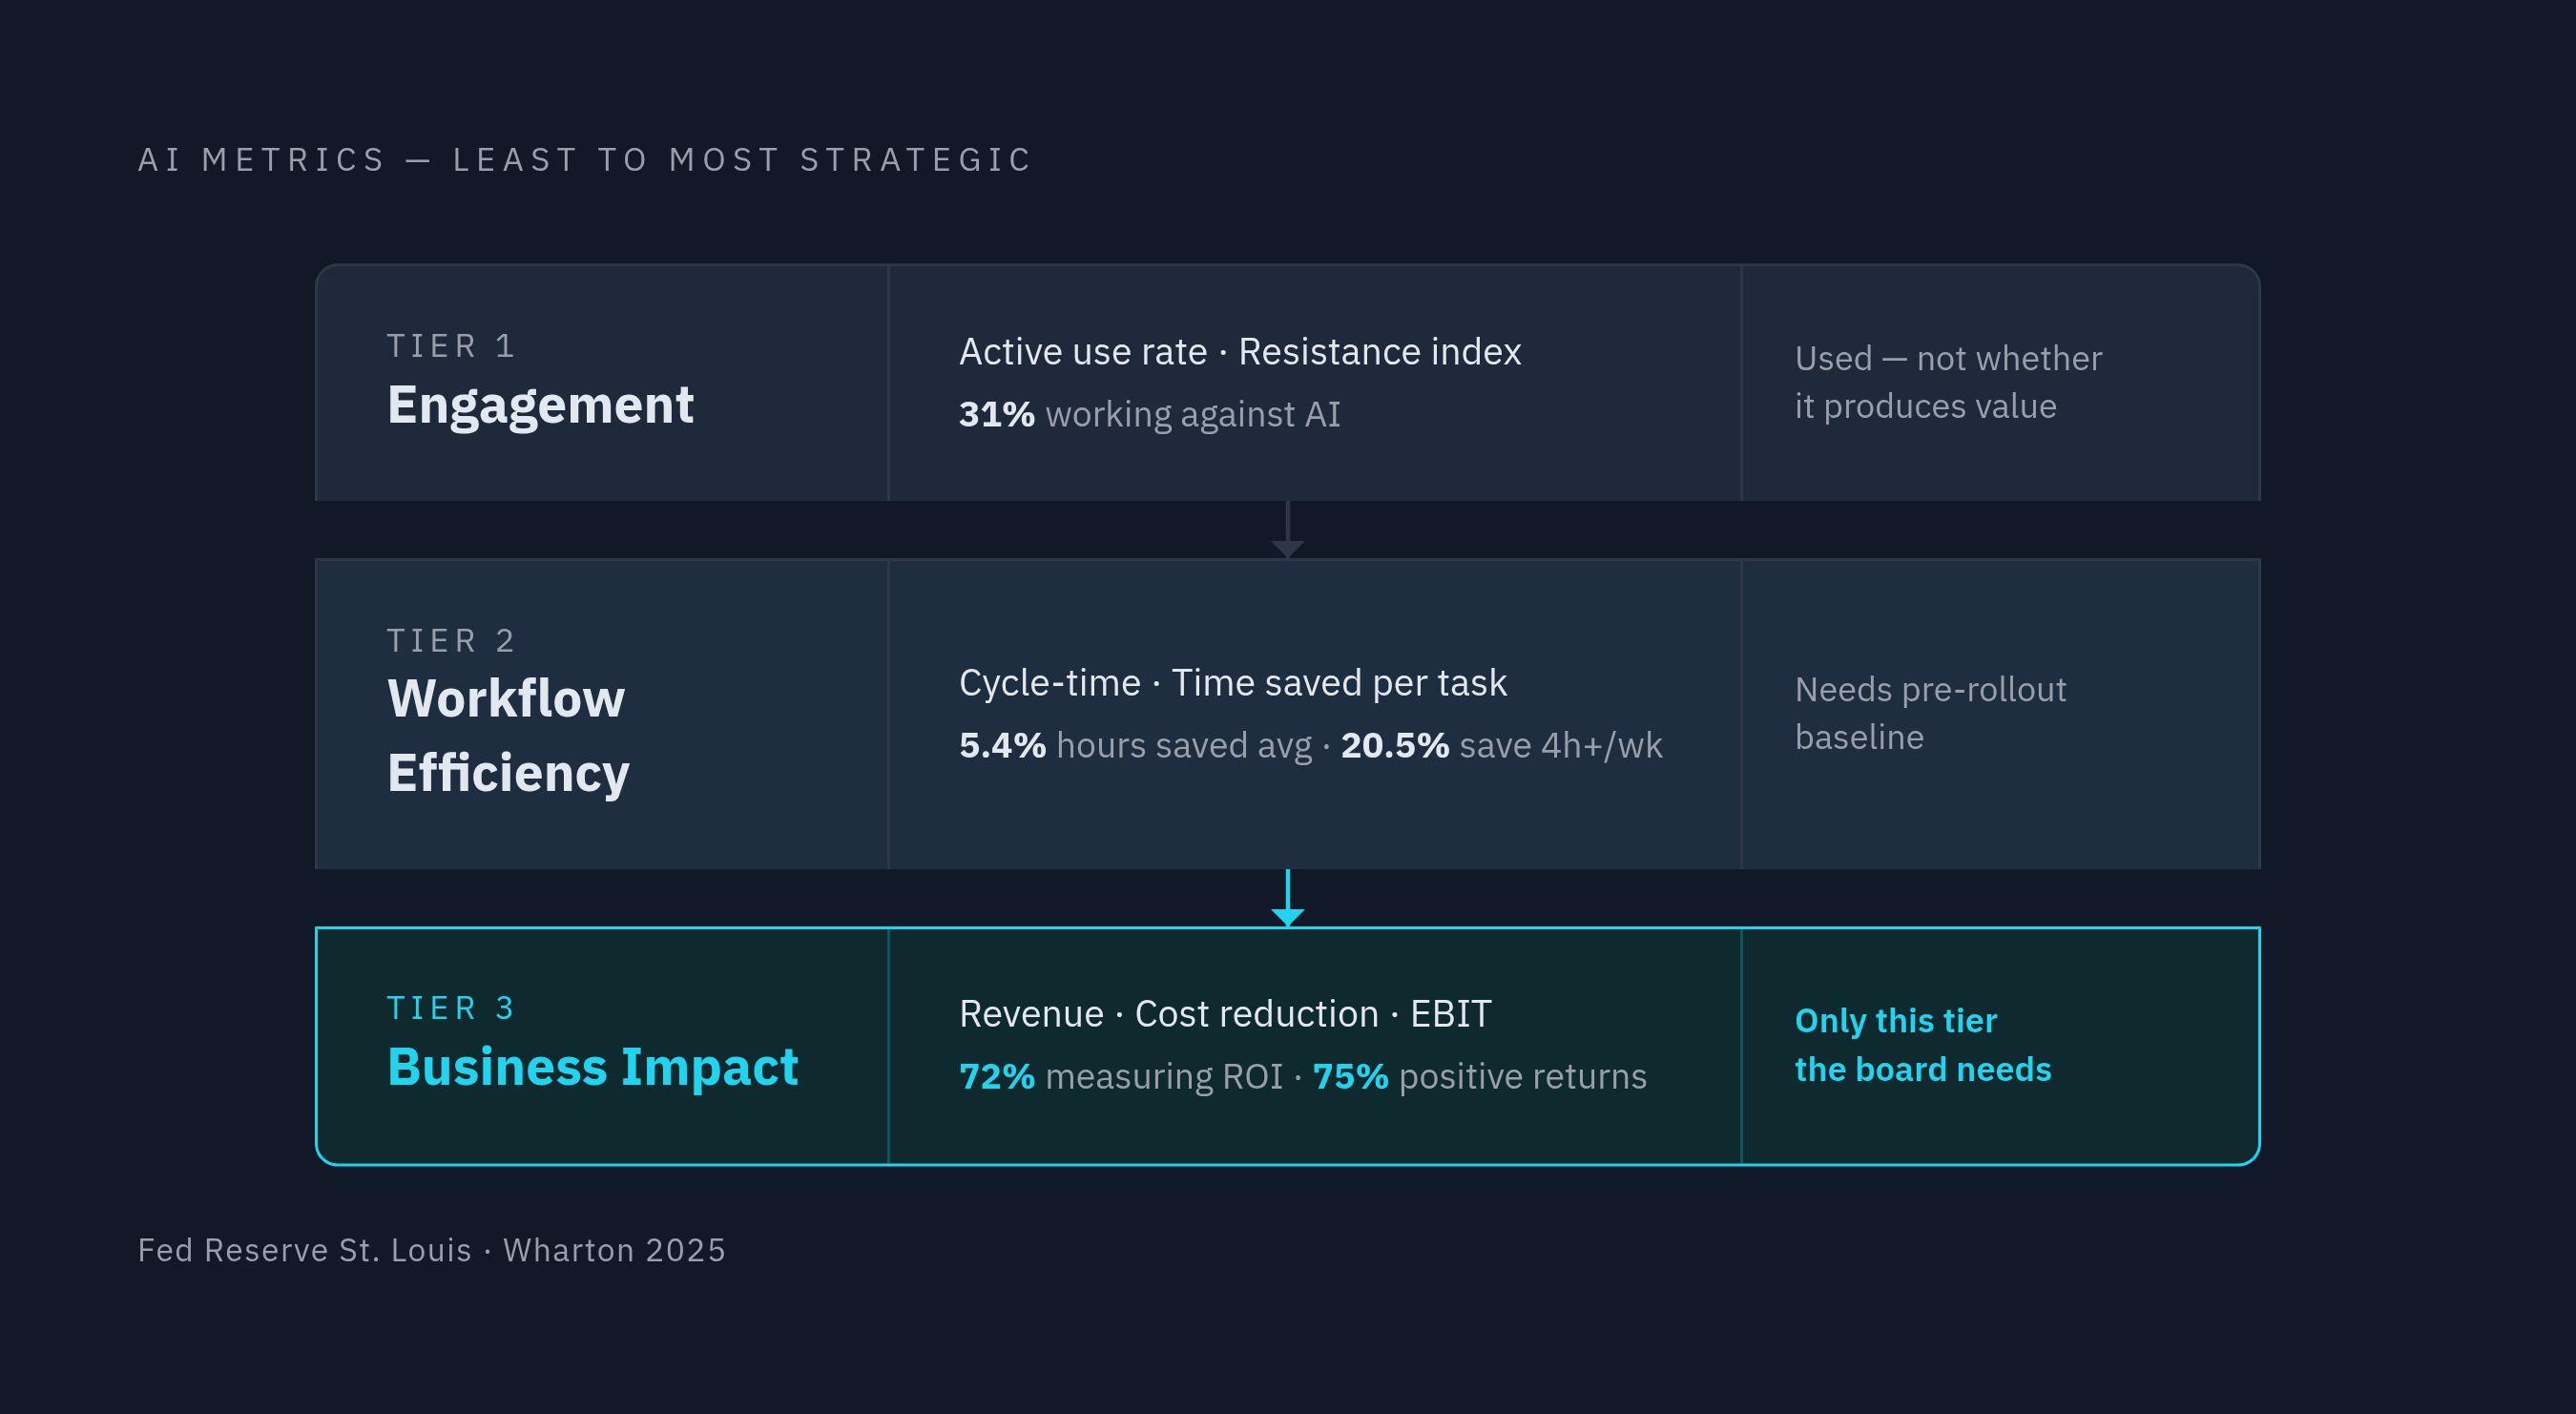
Engagement metrics are necessary signals, not sufficient evidence. The useful version is active use rate segmented by department and role, not raw license activations. Activations tell you what was provisioned. Segmented active use tells you where the tool actually lives in practice.
The most underused metric in this tier is what I'd call an employee resistance index: a composite drawn from support ticket volume, tool abandonment rates, manager feedback, and direct survey data. One survey found 31% of employees, with younger staff disproportionately represented, admitted to actively working against their company's AI initiatives. That resistance, if unmeasured, doesn't disappear. It silently corrupts adoption numbers, making a tool appear widely used while a meaningful share of apparent users are circumventing or ignoring it entirely.
Tier 1 tells you whether the tool is being used. It says nothing about whether that use produces anything worth producing.
Tier 2: Workflow Efficiency
Workflow efficiency metrics are the bridge between use and value. The anchor measurement is time saved per task compared to a pre-rollout baseline, which is precisely why the baseline problem addressed in the final section is not administrative overhead. It is the prerequisite for this entire tier.
Cycle-time compression is the most credible metric here: time-to-first-draft, mean time to resolution, time-to-market for specific deliverable types. Federal Reserve Bank of St. Louis data found that workers using generative AI saved an average of 5.4% of work hours in November 2024, with 20.5% of generative AI users reporting savings of four or more hours in a given week. Those are workflow efficiency numbers. Measurable, attributable, and the kind of data that supports a real conversation about whether the tool earns its cost.
Task selection matters as much as tool adoption, and this is where many organizations badly miscalibrate. Anthropic's data shows a software development request averages 3.3 hours of human-equivalent work; a personal management task averages 1.8 hours. High adoption concentrated in lower-value tasks is a cost center: the tool is being used, but the hours displaced aren't the expensive ones. Workflow completion rates, not launch rates, help surface this problem before it becomes entrenched.
Tier 3: Business Impact
This is what the board actually needs, and it's the tier most organizations skip because building it requires foundational work they didn't do before deployment.
The core metrics: revenue influenced by AI, modeled at the deal, lead, or upsell level; cost reduction expressed as hours saved multiplied by fully loaded labor cost; risk metrics including compliance incidents avoided and audit findings reduced; EBIT contribution segmented by function. Wharton's 2025 AI Adoption Report found 72% of enterprise leaders are formally measuring generative AI ROI with a focus on productivity gains and incremental profit, and three out of four report positive returns. The measurement infrastructure exists. It just has to be built deliberately, before deployment, not retrofitted after the fact when the CFO starts asking questions.
Each tier has a distinct job. Tier 1 monitors deployment health. Tier 2 validates that work is actually changing. Tier 3 confirms that the business moved. None of them substitute for the others, and any organization that reports only Tier 1 numbers while claiming enterprise-wide ROI is, charitably, confused about what it's measuring.
How to build the before/after baseline that makes outcome measurement possible
The most common reason Tier 2 and Tier 3 metrics fail in practice has nothing to do with measurement sophistication: nobody measured the workflow before the tool arrived. Without a pre-deployment state, there's no delta. Without a delta, there's no proof. You're left with activity data and testimonials, which is a fine foundation for a slide deck and a poor foundation for a budget defense.
A credible baseline requires three things: system-level telemetry on current task completion times and cycle times, a clear scope definition specifying which workflows, teams, and functions are being measured, and a control group or pre-period comparison built from behavioral data rather than self-reported estimates. Survey-based estimates of time spent are not baselines. They're perceptions. As the METR trial data shows, perception and performance can move in opposite directions.
One failure mode worth naming explicitly is the compounding step problem. Organizations measure each AI-assisted step as a success without checking whether the end-to-end workflow outcome improved. A chain of locally efficient steps can still produce a worse aggregate result, particularly when handoffs between steps are where errors accumulate. The baseline has to encompass the full workflow, not just the steps that are easy to instrument. I've seen this sink otherwise well-designed measurement programs because the team optimized for what was trackable rather than what mattered.
Governance structure helps. When a capability is built once, versioned, and reused across teams through a shared registry or governed agent deployment, the baseline is consistent across every instance. Measurement accumulates rather than resetting each time a new team starts a new pilot. Gartner's 2025 research found 45% of high-maturity organizations keep AI projects operational for three or more years, compared to 20% of low-maturity firms. Sustained measurement requires sustained deployment. Repeated pilots produce repeated baselines that never connect into anything coherent.
The practical starting point is deliberately narrow. Pick one workflow. Instrument it before deployment using system-level data. Measure time-to-completion and error rate throughout the rollout. Connect the delta to a cost line or a revenue line. That's the template, and it produces a clean, attributable signal precisely because the scope is constrained enough to support a causal claim. Once it works for one team, version it, document it, and deploy it the way you'd deploy any other organizational asset. Organizations that do this stop accumulating pilots and start accumulating evidence — and that distinction is the whole game.