Measuring the Business Value of a Company Knowledge Graph
Knowledge graphs turn AI pilots into measurable business outcomes by wiring data together.
Most companies measure AI adoption by counting pilots launched, not dollars returned. That's backwards, and it's why MIT's NANDA initiative found that the vast majority of enterprise generative AI pilots never show up on a P&L anywhere. Only a small slice produce real revenue acceleration. The rest just sit there, and a lot of companies have already started walking away from most of what they built. Gartner's own read is even blunter: they expect a significant chunk of agentic AI projects to get cancelled by the end of 2027, and the reason isn't model quality. It's that nobody can point to the business value, and nobody built the risk controls to trust the thing anyway.
I've spent enough time in these deployments to tell you the failure isn't the model. It's the plumbing.
Production data at most companies is scattered across a dozen systems, labeled inconsistently, and governed by nobody in particular. IBM's research backs this up: most enterprises report real workflow disruption caused by data living in silos that don't talk to each other. Gartner's numbers point the same direction; most organizations don't have data that's actually ready for AI to use. So you end up with a model that's plenty smart, sitting on top of information that's a mess, plugged into workflows that were never redesigned to act on what the model says. And once it's live? Almost nobody's watching it.
The clearest version of this problem is what I call the N×M trap. Say you've got N AI agents and M internal tools. If every connection between an agent and a tool has to be custom-built, your complexity doesn't grow with your ambition, it grows quadratically. Ten agents and ten tools isn't 20 connections, it's 100. This is the exact problem knowledge graphs and a protocol called MCP were built to solve. And until you solve it, asking "what's our ROI on AI" is premature. You can't trace a return to a system that was never actually wired into your real operational data in the first place.
So the measurement problem people keep trying to solve is really an architecture problem wearing a disguise. Fix the wiring, and the returns become something you can point to.
What a company knowledge graph actually is and why the analogy to other AI tools breaks down
A knowledge graph isn't a document store with a nicer search bar. It models entities and the relationships between them. Nodes are real things: a person, a product, a project, a customer account. Edges are the relationships connecting them, and they're typed: "owns," "reviewed," "depends on," "contradicts." Ask a graph "who's the best person to review this spec," and it doesn't run a keyword match. It traverses relationships, the way you'd think through the question yourself if you knew the org chart cold.
Here's the distinction that actually matters day to day: an LLM is the engine, a knowledge graph is the map. The engine provides raw generative horsepower. Left alone, it moves fast in whatever direction the prompt points it, correct destination or not. The graph is what tells it where "correct" actually is, grounded in your company's actual entities and actual relationships, not the model's best guess from training data.
This is also why a knowledge graph doesn't behave like most software you buy. Most tools depreciate. A model subscription gives every single customer the identical capability on day one and day 500; there's no compounding, you're just renting intelligence month to month. A knowledge graph is the opposite. Every entity you map, every relationship you refine, adds to the value of every AI output that comes after it. An organization twelve months into building their graph has something a competitor can't just go buy with the same OpenAI subscription. That's a structural head start, and it doesn't erode, it compounds.
The market's already voting on this. The enterprise knowledge graph category is worth billions of dollars now, and Grand View Research and MarketsandMarkets both project fast compound growth through the early 2030s. Semantic search and enterprise knowledge management make up the largest application segment. Cloud deployment dominates. Large enterprises account for most of the spend, North America leads adoption, and you've got both the big incumbents and a growing crowd of specialized vendors fighting over who does graph-native AI grounding best.
The metrics that actually capture what a knowledge graph returns
Forget "AI lift" as a concept. It's too vague to manage against. What I've seen work across production deployments is tracing ROI to five specific use cases: customer 360, hallucination reduction, fraud detection, supply chain mapping, and compliance management. Each one maps to something you can put a number on, not a vibe.
Hallucination reduction is the easiest to measure and the one I'd start with. GraphRAG setups consistently beat plain retrieval on accuracy, especially for the complex, multi-hop, relationship-heavy questions that trip up a standard RAG pipeline. A 2025 Gartner report found organizations running structured knowledge layers cut their AI error rates by more than half versus standard RAG. One hospital network wired clinical records and research literature together through a knowledge graph and saw adverse drug events drop materially in the first year, a safety outcome with an obvious dollar figure attached to it.
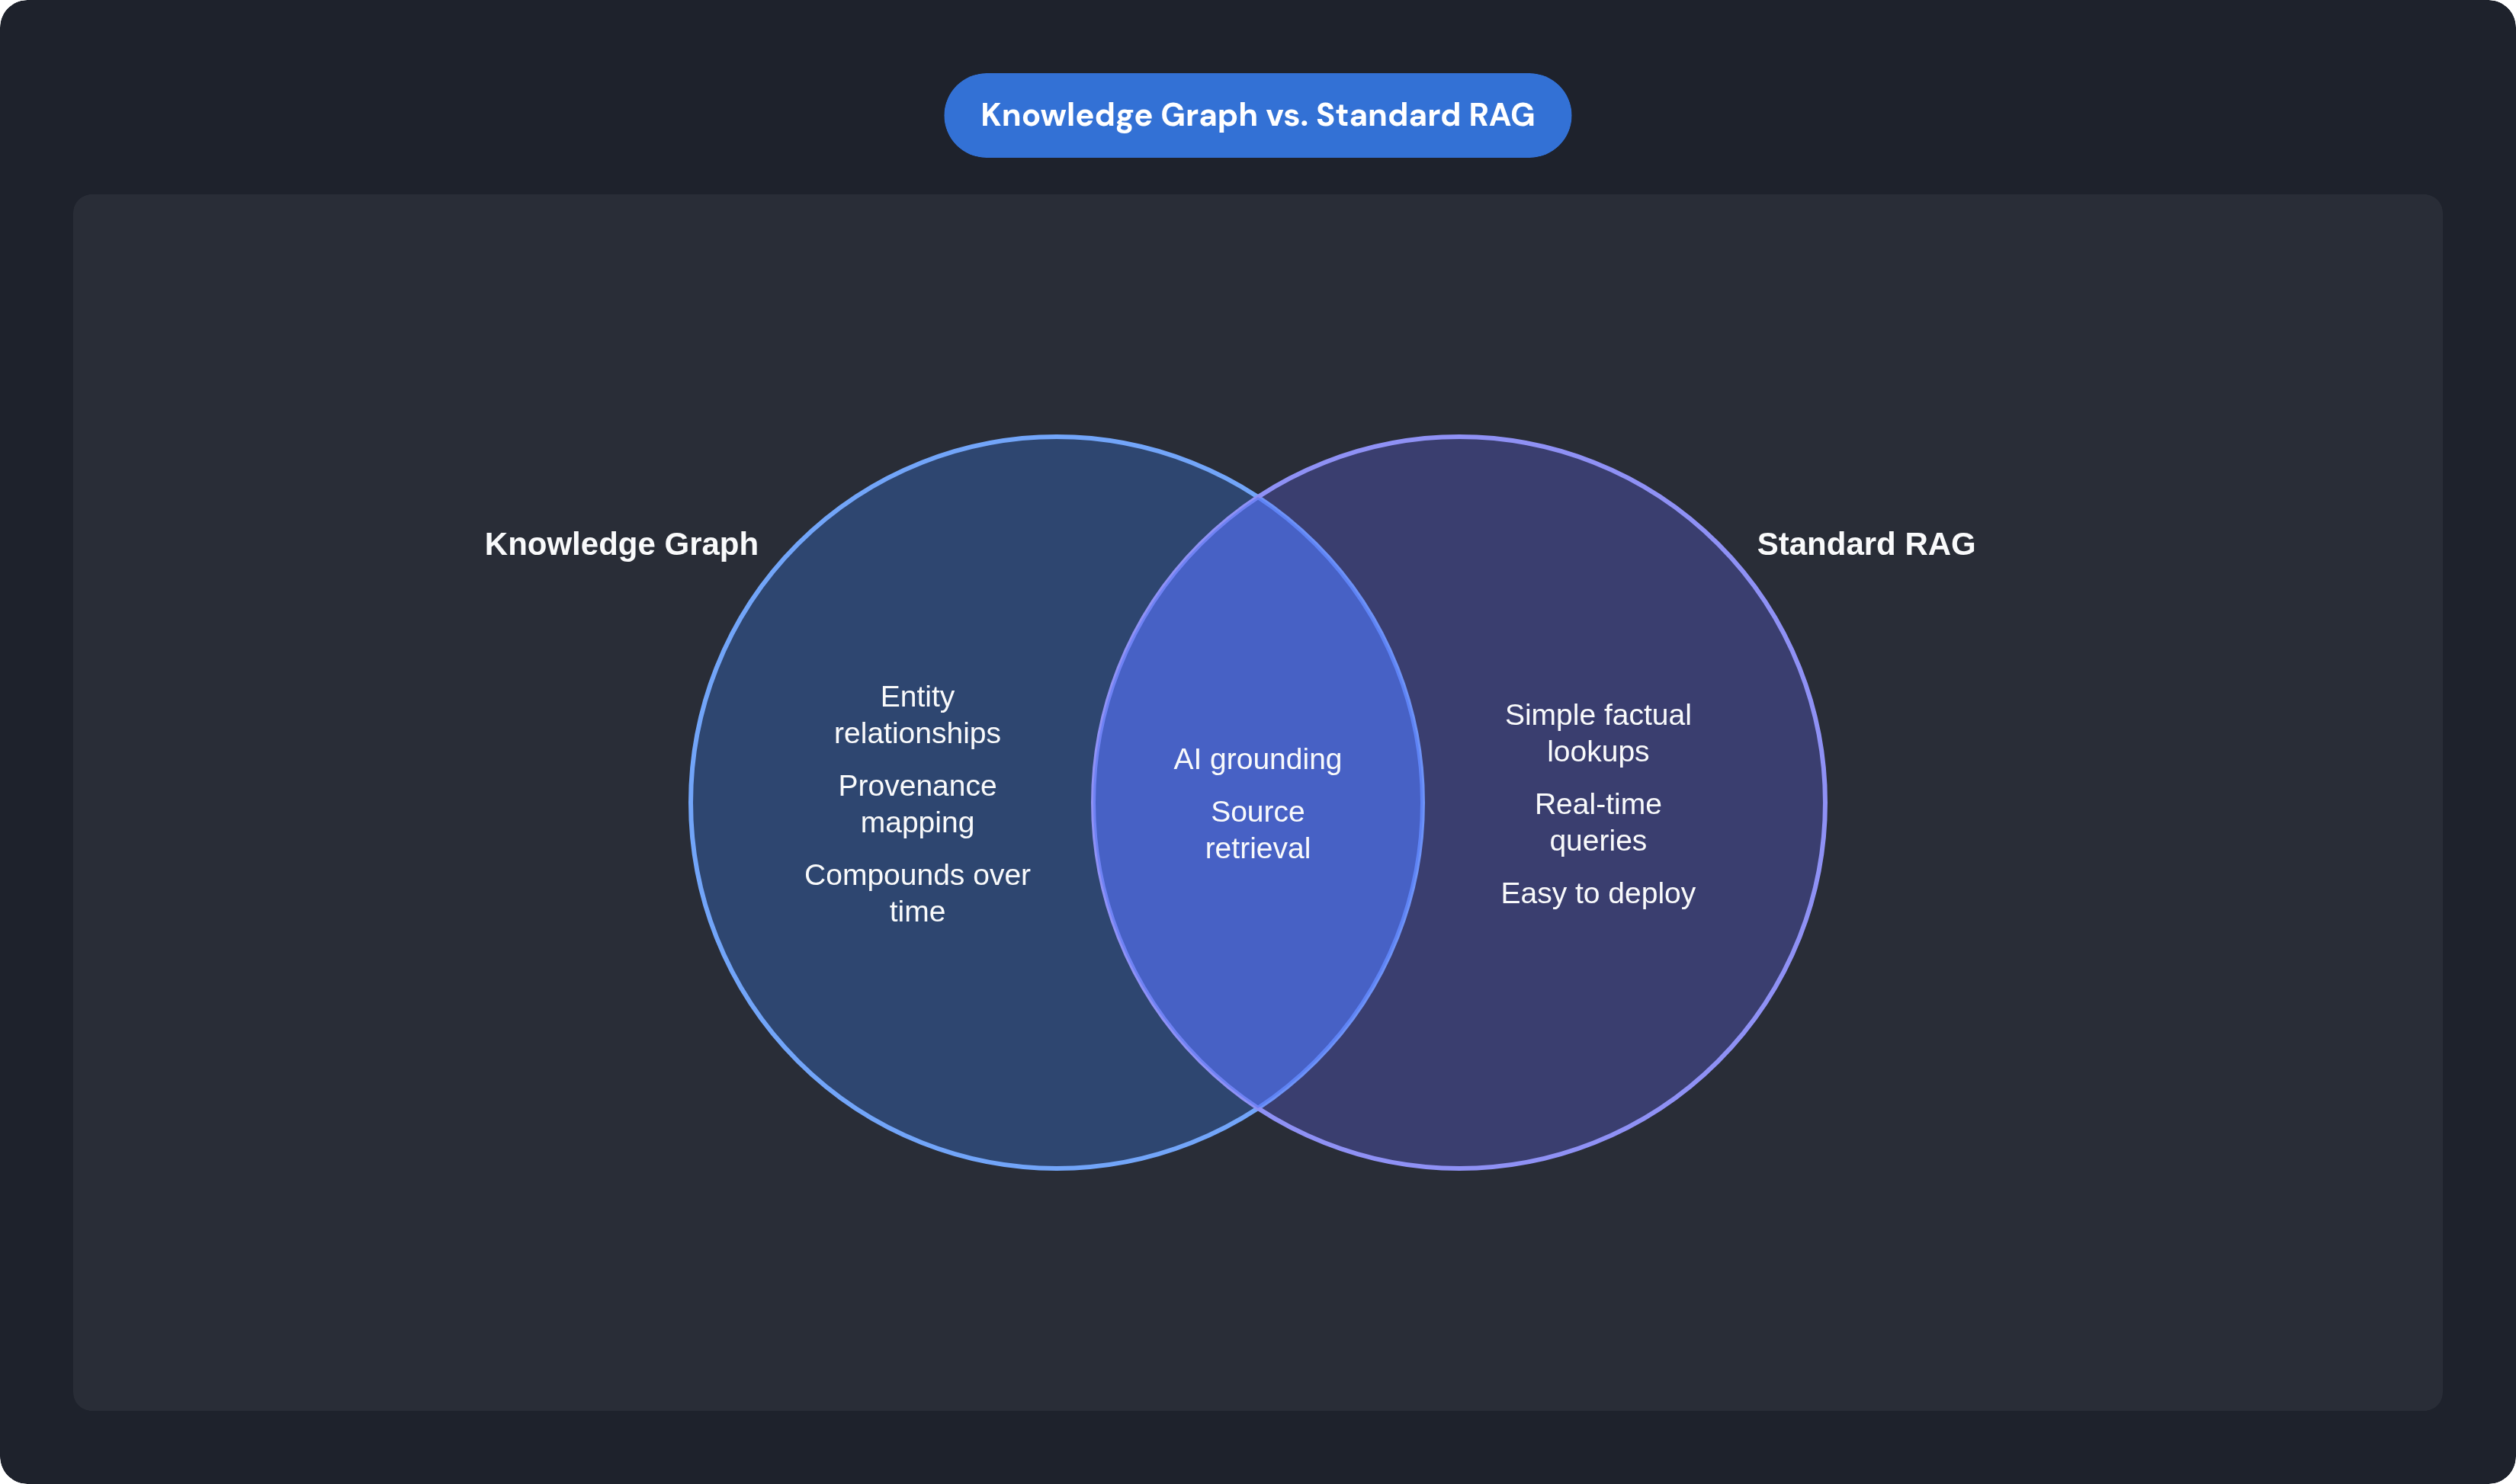
I want to flag the counterpoint here, because it matters: GraphRAG doesn't win everywhere. A 2025 study found it actually loses ground on simple factual lookups and on time-sensitive queries that need real-time updates. The case for a graph is strongest on complicated, relational questions. It's not a universal upgrade, and anyone telling you otherwise is selling something.
Ticket and cycle time reduction gives you the cleanest before-and-after story of any metric on this list. LinkedIn routed support queries through a GraphRAG system and cut resolution time substantially against manual knowledge-base searches. What I like about this metric is that most operations teams already track cycle time, so there's no instrumentation to build. You're just watching a number you already have move.
Retrieval precision is underused, and it shouldn't be. One semiconductor manufacturer ran GraphRAG over tens of millions of internal documents and saw entity hallucination fall off a cliff, with retrieval precision climbing enough that a large engineering population now uses it daily. Precision and recall from the retrieval pipeline itself move before the downstream business metrics do. That makes them a leading indicator, not just a technical footnote.
Duplicate work is the metric everyone feels and almost nobody tracks. Multiple teams rebuilding the same prompt, the same lookup, the same little internal tool, over and over, is a real cost, and it compounds across departments quietly. A shared graph with governed access is what actually surfaces this waste, because siloed tooling has no way to show you the overlap in the first place.
And then there's explainability, which I'd bet becomes mandatory rather than optional within a few years. EU regulators, and US regulators trailing behind them, are moving toward Explainable AI requirements. Standard RAG gives you a source list. A knowledge graph gives you a provenance map: the actual entity traversal that produced the conclusion. For anything high-stakes, that's not a nice extra, it's the only architecture that actually satisfies an auditor asking "how did the system get here." Audit prep time and error rates in regulated workflows become measurable outcomes that only a graph-based setup can really deliver.
How MCP turns a knowledge graph from a single system into a company-wide context layer
The N×M trap I mentioned earlier doesn't just live inside the knowledge graph. It lives everywhere AI touches your tools. Without a shared protocol, every AI surface needs its own custom connector to reach the graph, and you're back to quadratic complexity. MCP, the Model Context Protocol, fixes this by defining one universal, stateful, two-way interface. Any compliant AI client reaches any compliant server. Your connection count goes from M times N down to M plus N. Think of it like USB-C replacing a drawer full of proprietary charging cables; one port, everything plugs in.
MCP's backstory matters here too. Anthropic open-sourced it in late 2024, and by the end of 2025 it had been handed over to the Linux Foundation's Agentic AI Foundation, with AWS, Google, Microsoft, OpenAI, Bloomberg, and Cloudflare all backing it. That's the same governance path Docker and Kubernetes took on their way to becoming infrastructure everyone just assumes is there, rather than a bet on one vendor's roadmap. Forrester projects a large share of enterprise SaaS vendors will ship their own MCP servers by the end of 2026. The tools you already use are quietly turning AI-native underneath you.
Put a knowledge graph and MCP together and you get something neither one delivers alone. The graph supplies the semantic and relational intelligence: structured entities, typed relationships, the business rules that actually govern how your company operates. MCP is the standardized wire that gets that intelligence out to wherever someone's asking a question, Claude, ChatGPT, Cursor, Slack, some internal app nobody outside the company has heard of. Ask the same question in three different tools, and you get an answer grounded in the same governed context every time, instead of three different retrieval stacks giving you three different half-answers. BCG called MCP "a deceptively simple idea with outsized implications," and that's the reason why: the integration effort grows only linearly, while the surface coverage you get out of it scales far beyond what the connection count would suggest.
That cost reduction shows up on a balance sheet, not just in a satisfaction survey. Teams that moved from point-to-point API connections to MCP-based architectures have reported cutting their integration costs substantially. That's headcount that used to babysit connectors, now doing something else.
Where department-level returns are highest and how to instrument them
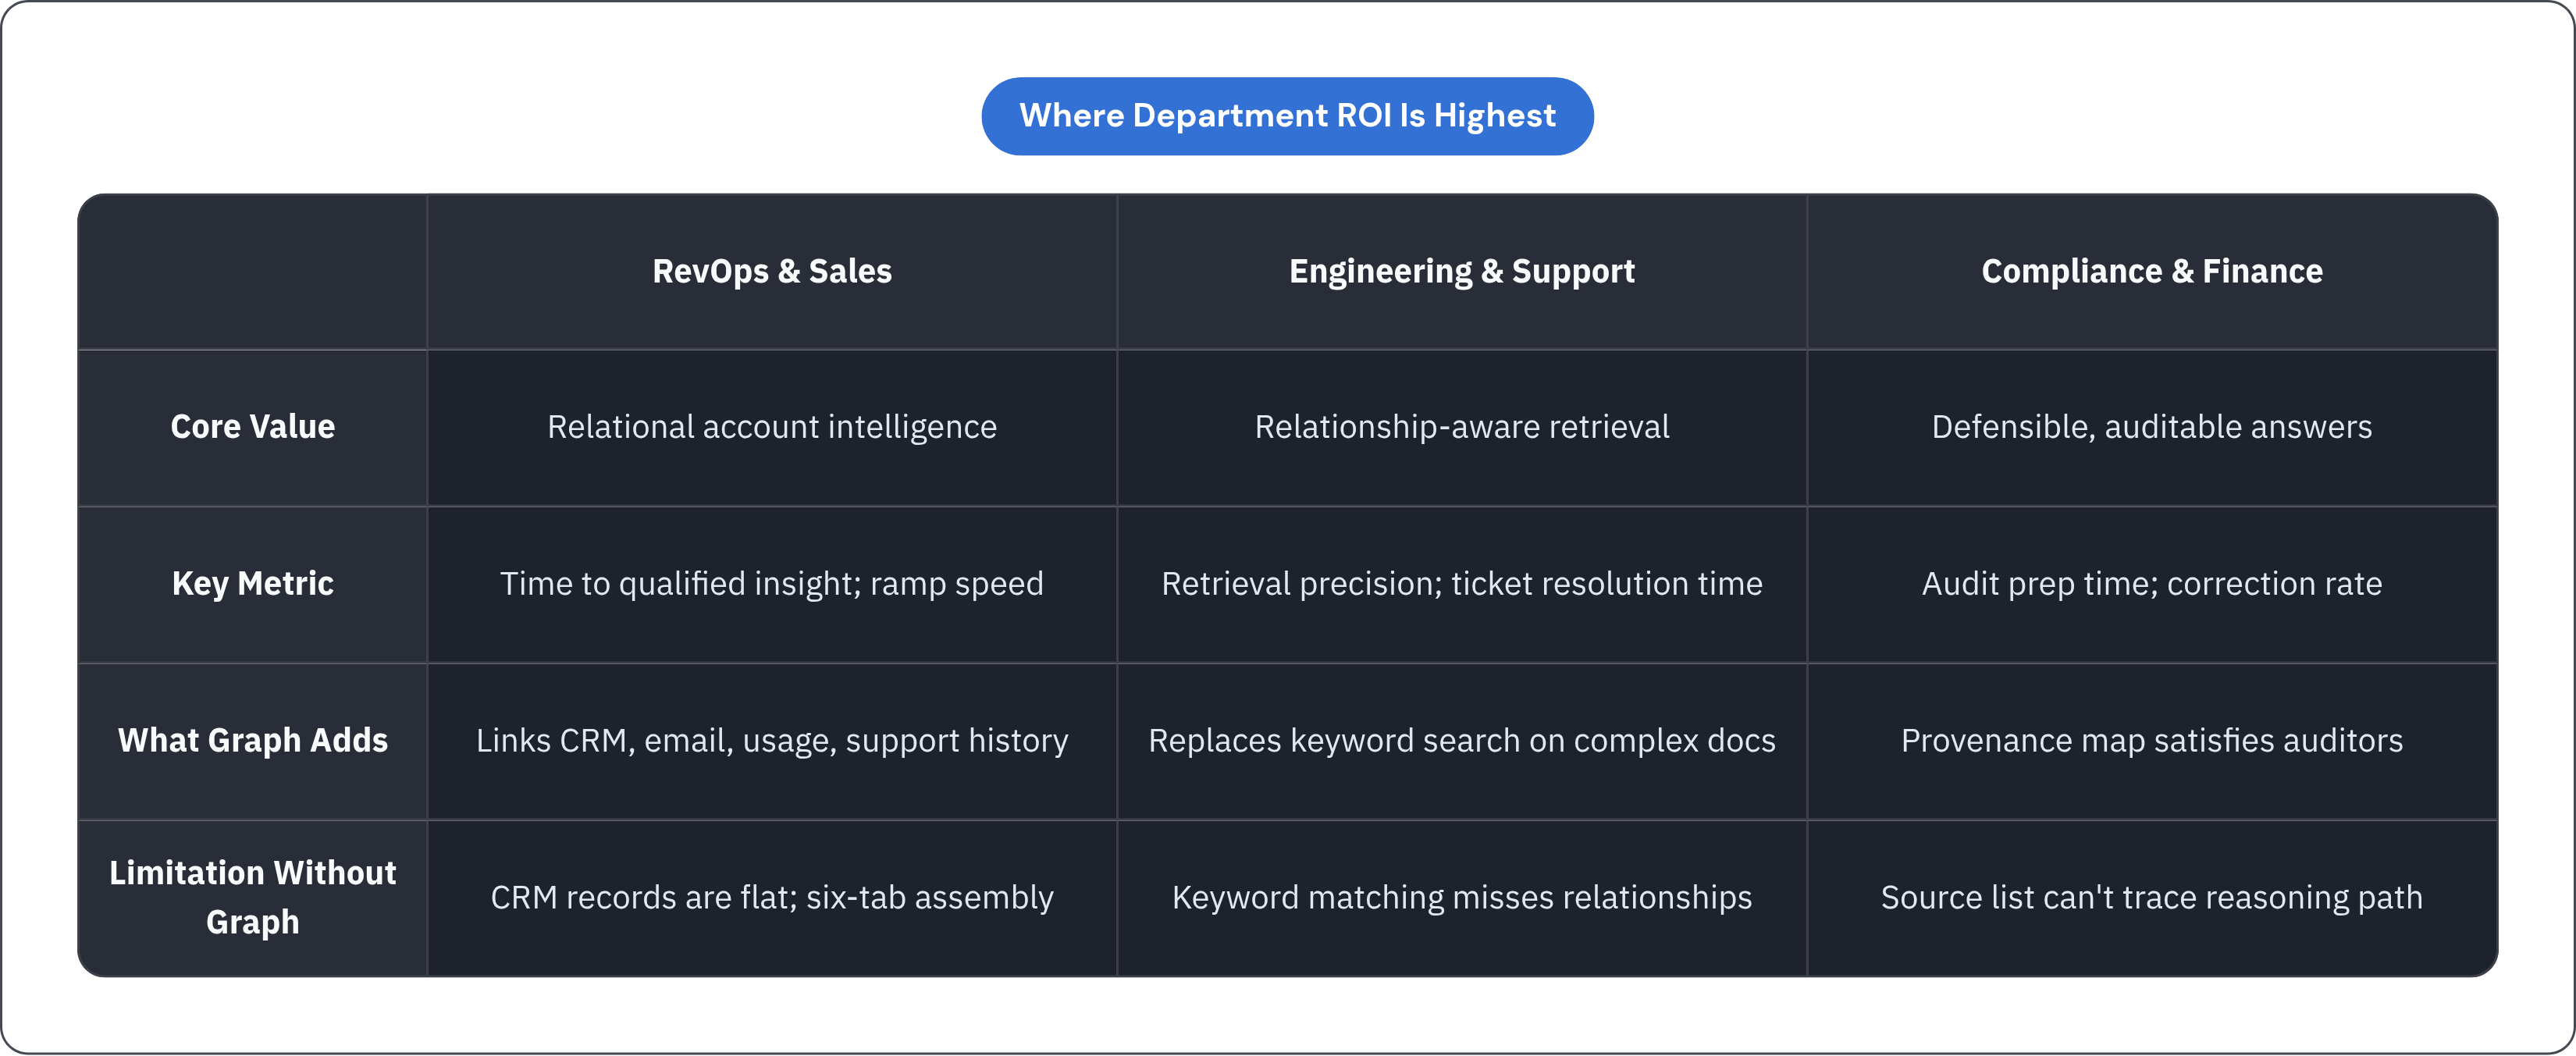
RevOps and sales live and die on questions that are inherently relational: what's our full history with this account, who actually knows this buyer. A CRM record alone is flat. A knowledge graph that connects CRM data with email threads, product usage, and support history answers questions a vector search just can't touch. Watch time from opportunity creation to a rep getting a qualified insight, and watch how fast a new rep ramps when account context is sitting there waiting for them versus assembled by hand from six different tabs.
Engineering and support are where retrieval precision earns its keep. The semiconductor example is the clean case: a huge engineering population, tens of millions of documents, and questions that need relationship-aware retrieval instead of keyword matching. LinkedIn's support deployment is the same story in a different department, cycle time dropping once queries route through the graph instead of a manual search. Track retrieval precision straight from the pipeline, ticket resolution time, and escalation rate.
Compliance and finance get a different kind of return, and it's not speed, it's defensibility. A provenance-mapped answer means you can show an auditor exactly how a conclusion was reached. Track audit prep time, the count of AI-generated decisions that needed manual correction, and the regulatory finding rate.
There's a compounding effect worth calling out here too. A graph built to serve one department's use case ends up encoding entities and relationships that neighboring teams can query without starting from zero. But that only becomes visible with a governed registry tracking which skills are actually in production, who owns each one, and what data they touch. Without that registry, reuse happens informally, word of mouth, and nobody can measure it. A well-governed registry model, where a skill gets captured once and published with permissions inherited automatically, is built to close exactly this gap. Reuse becomes something you can audit instead of something you just hear about at a team lunch.
Governance as the precondition for measurement, not a feature layered on top
An ungoverned graph gives you returns you can't see and risks you can't control, and those two problems are the same problem. If permissions get redefined tool by tool instead of inherited from the source systems, access drift creeps in without anyone noticing. Answers start pulling from data a user was never supposed to see, and there's no record it even happened. If there's no version history on your skills and agents, you can't say which version of a workflow produced a given output, and once you can't do that, attributing any ROI to it is a guess dressed up as an analysis.
Inherited permissions aren't a convenience feature. They're a measurement instrument. When an agent can only pull from what the person asking already has access to, every single output has a traceable, governed context behind it. That's what lets you measure hallucination reduction at the level of an individual user, not just as a system-wide average that hides the outliers.
The regulatory timeline isn't waiting around for companies to get their governance in order. EU and US movement toward Explainable AI mandates means the governance work you do now doubles as compliance infrastructure for rules that are already on the way. Companies bolting governance on after the fact are going to pay for remediation, and that cost eats directly into whatever gains they thought they'd already banked.
There's a security angle here too, and it's not hypothetical. Independent researchers spent 2025 documenting prompt-injection risks, over-permissioned tokens, and command injection in poorly built MCP servers. An agent that can be manipulated at the transport layer produces answers you can't actually trust the origin of, and at that point, whatever you thought you were measuring stops meaning anything. Least-privilege access, versioned skill registries, audited action logs: these aren't governance nice-to-haves bolted on for compliance theater. They're the reason your measurements are worth believing in the first place.
Building toward measurement: a phased implementation that produces trackable returns from the start
Start by connecting, not deploying. Before any agent goes live, figure out which systems actually hold the entities and relationships tied to your highest-value use cases from earlier: customer 360, fraud detection, whatever fits your business. Map the permission model in those source systems first; inherited permissions are the governance foundation, and they need to exist before an agent ever surfaces an answer to anyone. This is also the moment to write down your baseline numbers: current retrieval precision, current ticket resolution time, current duplicate work volume. Skip the baseline, and you'll have no honest way to claim a return later.
Then pilot, and pilot on something hard. GraphRAG's advantage shows up clearest on complex, multi-hop queries, so that's where you start, not on simple factual lookups where traditional retrieval already holds its own. Pick a use case where the before-and-after is visible at the team level without building new instrumentation from scratch, and set your retrieval precision and cycle-time targets before you launch, not after. Those targets become your first real evidence, one way or the other.
From there, the work is publishing skills into a governed registry so what one team builds, another can actually find and reuse, instead of every department reinventing the same lookup from scratch six months apart.