Measuring Developer Productivity Gains From AI Coding Assistants
Context matters more than any single productivity number for AI coding tools.
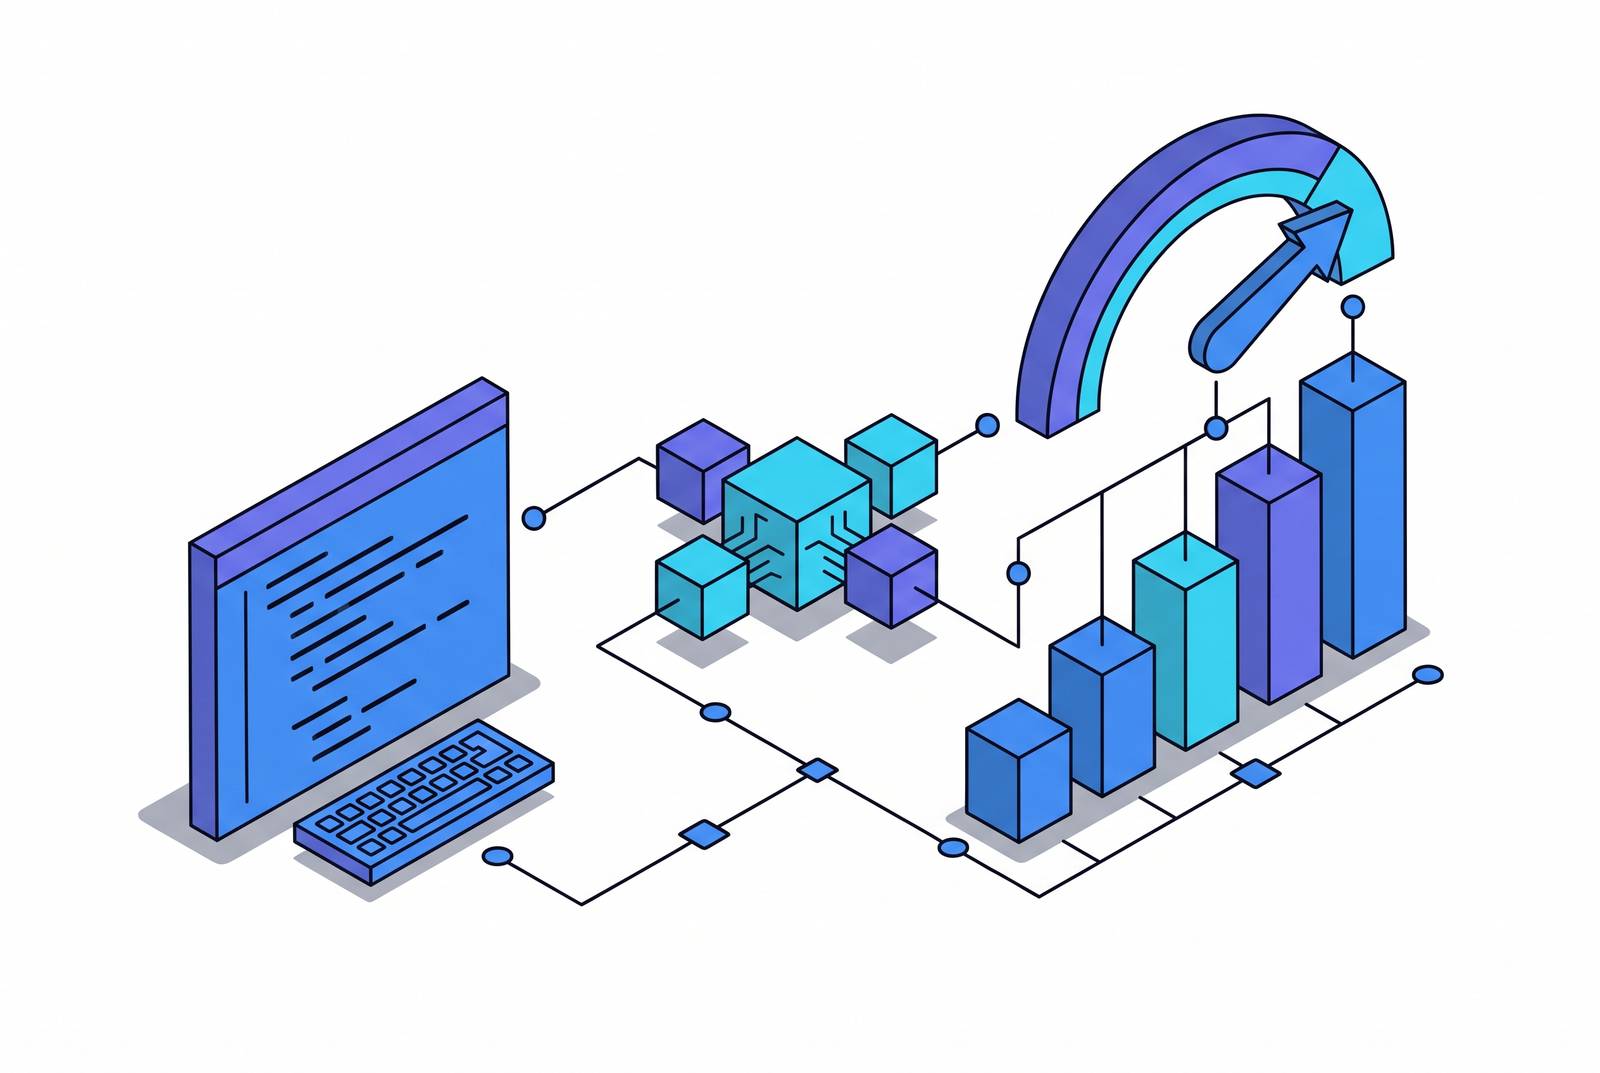
Measuring developer productivity gains from AI coding assistants means separating faster code generation from better engineering output. Gains depend on the work, the developer and the finish line being measured. A useful framework measures difficulty-adjusted delivery, quality and cost, then separates results by the conditions that produced them.
Why the same AI coding tools produce wildly different productivity numbers
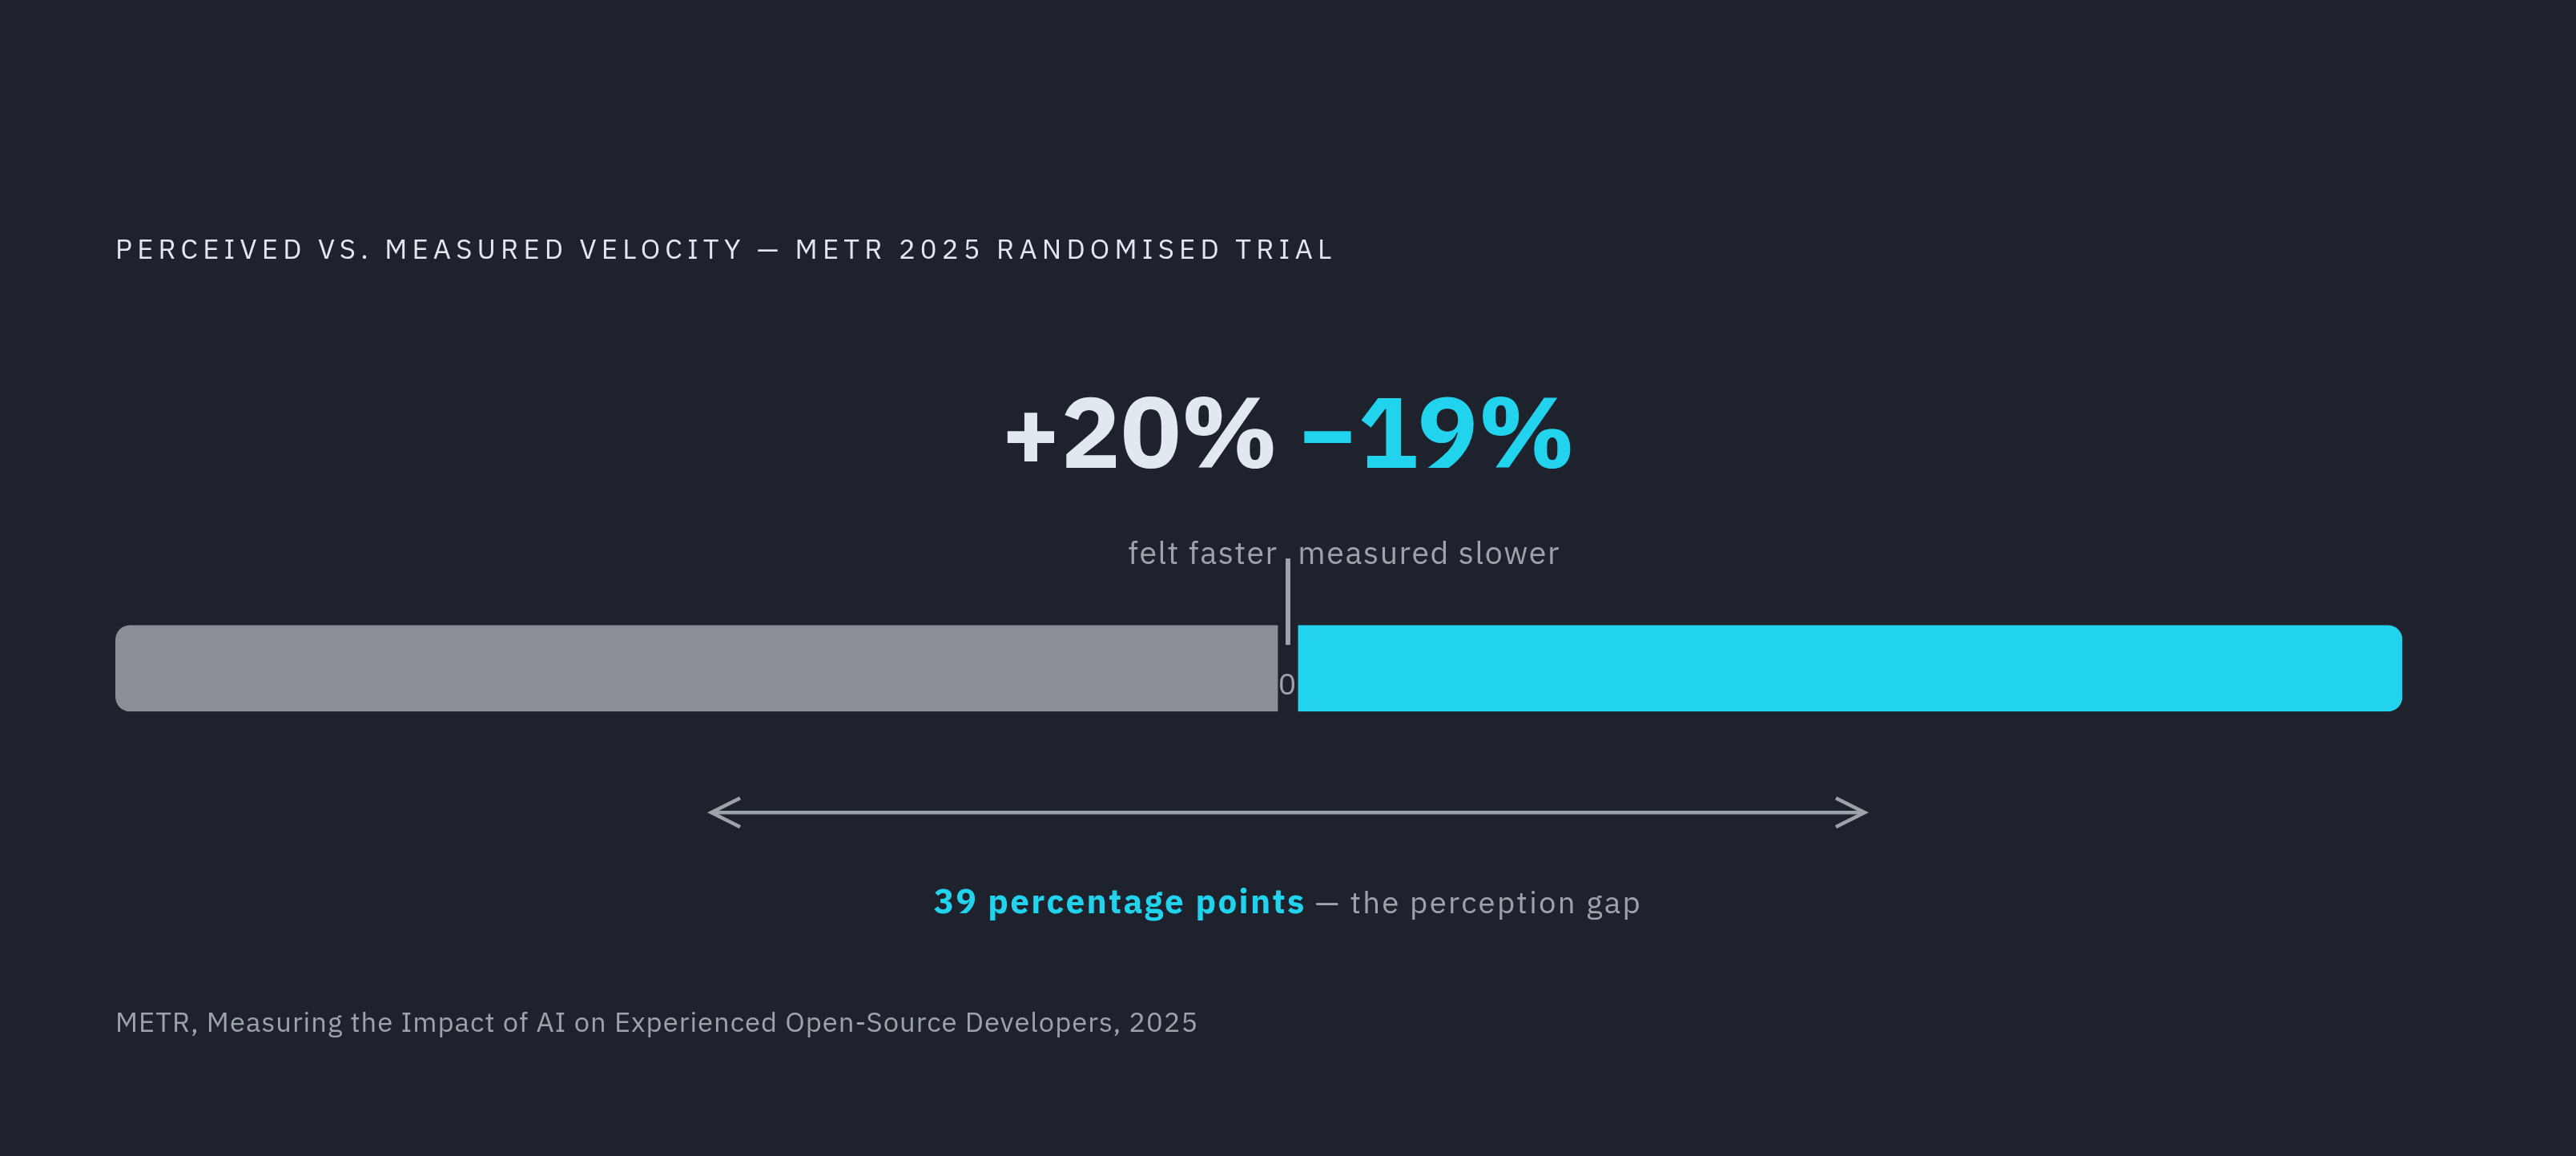
METR’s 2025 randomized trial found that experienced developers using Cursor Pro with Claude 3.5 and 3.7 Sonnet took substantially longer to finish tasks on large open-source codebases. Yet those developers estimated that AI had made them faster by roughly the same margin. The measured result and the felt result pointed in opposite directions. That makes the trial more than evidence of a slowdown in one setting. It shows why the measurement method matters before any headline productivity number can be useful.
GitHub’s 2022 Copilot controlled experiment found a 55.8% faster completion time on a single well-defined task. Cui et al.’s 2024–2025 field experiment across thousands of developers in real jobs found a substantially positive result across a broader mix of work. These findings need not contradict METR’s result because they measured different conditions. Greenfield work and boilerplate are not the same as changes to mature codebases that developers know deeply. Nor is code written the same finish line as code merged and stable.
Studies are therefore useful when they measure work that resembles the work a team actually does. How good the tools are and how skilled the developers are cannot by themselves explain results from studies that define tasks and their finish lines in different ways. Until those differences are visible, a single productivity percentage leaves out the information needed to interpret it.
Why developers cannot accurately judge their own velocity with AI
GitHub’s research found that acceptance rate, the share of shown suggestions developers accept, best predicts how productive they feel. That places the reward signal early in the workflow. A suggestion can feel useful as soon as it is accepted, before anyone knows whether the resulting code will survive review or production. How fast the work feels can therefore drift away from the value it delivers, even when people judge it with care.
This is a systems problem. Self-reports can describe satisfaction and the experience of using a tool. They cannot establish how much useful work reached the finish line. METR’s 2025 trial documented a 39-percentage-point miss between self-reported speed and timestamps. A productivity measure built mainly from those reports inherits that calibration error.
The distinction matters because continued use is not proof of improved delivery either. Developers can value assistance without being able to measure its net effect on their work. That leaves organizations with two separate questions, namely whether developers find the tool helpful and whether it improves engineering output. Both deserve an answer, but one cannot stand in for the other.
Why traditional volume metrics make the calibration problem worse
Lines of code, story points, commits per week and PRs merged were already imperfect proxies for value. AI makes these flaws harder to ignore because it can drive up the counts without helping teams deliver more useful work. A larger output count may reflect more completed work, but it may also reflect more code that needs replacing. The counter records both as movement. Without a quality measure, it cannot tell which kind of movement the team produced.
GitClear’s code churn data shows that churn rose substantially from a pre-AI baseline through 2024–2025. GitClear also found that duplicated blocks of five or more lines grew dramatically during 2024. Code that is soon deleted or substantially rewritten still boosts the original volume count. Duplication can do the same without adding a distinct capability.
Engineering benchmark data from one year to the next shows a similar split in delivery, as cycle time improved while median change failure rate worsened. Microsoft’s study of tens of thousands of engineers acknowledged this boundary even when using the cleaner signal of merged pull requests. A merged PR is still a proxy for output. Volume metrics can therefore hide quality degradation.
What task type and developer experience actually predict about AI lift
Task type is the strongest starting point for explaining the variation. METR’s negative result came from experienced contributors working on repositories they had used for years, averaging over a million lines. That finding applies to a specific setting. Gains can compress or reverse when the work involves mature code that the developer already understands deeply. Results from well-defined tasks cannot simply be carried over to that setting.
Experience also interacts with the work rather than producing a simple rule that one group always benefits more. METR’s February 2026 follow-up found a larger central estimate for returning developers than for new ones. But both confidence intervals were wide enough to include zero. Microsoft’s field study found that continued use was associated more with engineers’ coding activity than with demographic factors. Active coders kept using the tools, while less active coders did not.
Cui et al.’s 2024–2025 field experiment found large gains across a wide mix of tasks that people did as part of their usual work. That supports the case for real gains without making them universal. An aggregate metric can still be useful, provided it is segmented by task complexity rather than treated as a result that applies equally everywhere. Once the conditions are visible, teams can choose measures sensitive to those conditions. DORA and a developer productivity framework provide the foundation for doing that without reducing productivity to another activity count.
How DORA and SPACE together cover what neither covers alone
DORA is the starting point for measuring engineering delivery, but its metrics need to be read together. Lead time for changes can compress when AI speeds drafting and review latency falls. Deployment frequency can rise when test authoring stops being a bottleneck. Change failure rate acts as the guardrail against mistaking faster shipping for better delivery. Time to restore service captures the downstream consequences when quality shortcuts reach production.
That delivery view leaves out much of what developers immediately experience. DORA does not cover satisfaction, collaboration patterns, individual activity or cognitive load. SPACE adds satisfaction and wellbeing, activity, and communication and collaboration as explicit targets, together with performance and efficiency. These dimensions help describe where the feeling of improvement comes from. They do not turn that feeling into proof of faster delivery.
DORA can show how delivery has changed without showing what the work feels like, while satisfaction and activity measures can look good even when delivery gets worse. Together, they let a team compare the experience of AI-assisted work with its results. That combined view supports a more concrete measurement framework.
The five dimensions a measurement framework needs to cover in 2026
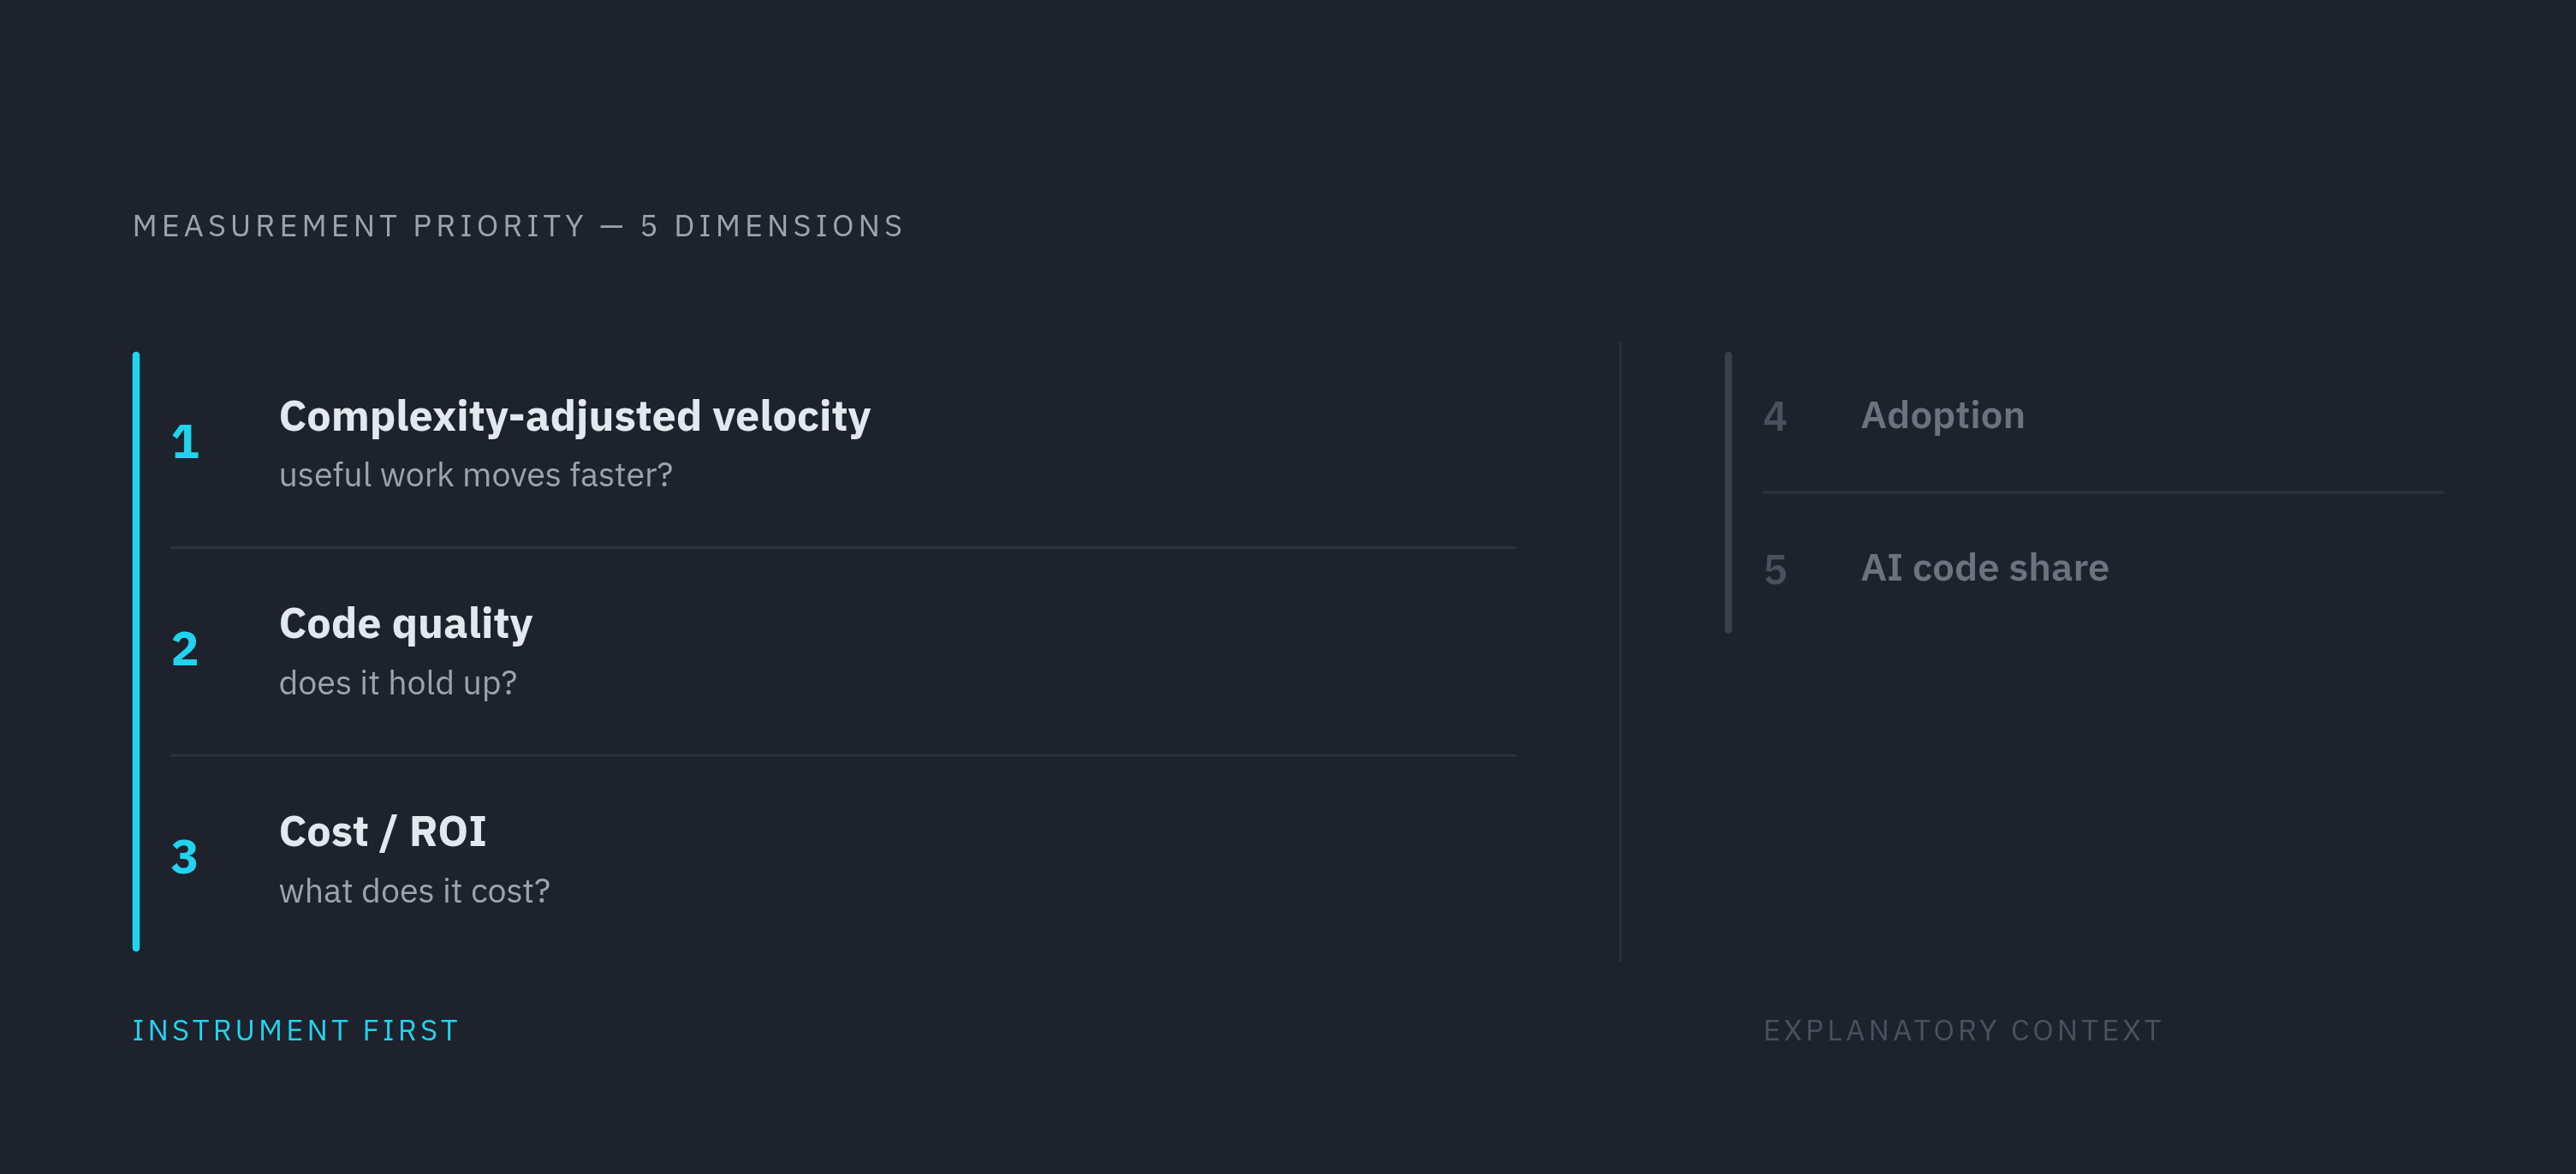
A defensible framework needs at least three of five dimensions, which are adoption, AI code share, complexity-adjusted velocity, code quality, and cost or ROI. If a team can instrument only three, it should start with complexity-adjusted velocity, code quality, and cost or ROI. Together, these answer whether useful work moves faster, whether it holds up and what the gain costs. Adoption and AI code share then help explain how the tools contributed. Neither is enough on its own to establish value.
Adoption measures use. Microsoft’s study found that people first tried the tool mostly through social networks, so tracking license activation alone misses how people come to use it. Weekly active usage and power user density show more of how people use the tool. Power users can pull adoption upward through peer demonstration. The useful distinction is between making a tool available and making it part of working practice.
AI code share measures the proportion of the codebase produced with AI assistance. It is separate from adoption because high weekly active usage can coexist with low AI code share when developers use AI only for documentation. It must also be paired with code turnover rate. Without that check on quality, a growing AI share is a vanity metric. It says more about how code was produced than whether it deserved to stay.
Complexity-adjusted velocity gives PRs more weight when they are harder to do. That keeps small, easy changes from making up too much of the output count. The 2026 benchmarks indicate that the AI velocity multiplier compresses at higher absolute complexity levels. Easy and medium PRs benefit more than hard ones. A useful velocity measure must preserve that difference.
Code turnover rate measures the percentage of code that is reverted, deleted or largely rewritten within a set time. Comparing AI-assisted and human-only turnover helps distinguish a general quality problem from one associated with AI-assisted work. Change failure rate also checks what happens in production. Cost or ROI completes the picture by including token costs at agentic scale, since counting only seat licenses understates the cost denominator.
How to segment measurements so the numbers reflect real engineering output
The framework becomes useful when its results are separated by task complexity, developer activity level and codebase maturity. Start with complexity because a change in the mix of tasks can make the result look different even when nothing else has changed. Complexity-adjusted throughput separates easy, medium and hard PRs. An organization doing mostly hard work should not expect the same AI multiplier as one producing mostly boilerplate. An aggregate comparison would confuse a difference in work with a difference in tool effectiveness.
Next, separate results by developer activity level. Microsoft’s study found roughly a quarter more merged pull requests from tool adopters, but the lift was not uniform. Retention and output gains were associated with engineers who were already actively coding. Combining their results with the near-zero effect on less active engineers produces an average that describes neither group well. The segmented result can guide a decision because it shows where the gain actually occurred.
Teams also need to split results by codebase maturity. METR’s 2025 trial examined developers working on familiar, complex codebases, which makes its slowdown relevant to that setting. Teams that maintain large legacy systems should therefore use different baselines from those that build new services. Otherwise, the measurement treats materially different work as interchangeable. The result may be numerically tidy but operationally misleading.
A standing calibration check should track the gap between self-reported speed and measured throughput. A persistent large gap suggests that the reward signal is still firing at suggestion acceptance, before merge-and-stable. This lets teams use developer feedback alongside measures of the work itself. The aim is a number that can support a decision while making the conditions behind it visible.
What governance infrastructure makes measurement sustainable as AI tool use scales
Segmentation depends on consistent data, and that consistency becomes harder to maintain as tool use spreads. Teams using different tools, contexts and permission boundaries can produce numbers that reflect configuration as much as engineering output. A change in data access can look like a change in productivity. If access is not tracked with usage, the measurement cannot distinguish the two. Governance is therefore part of measurement continuity.
Microsoft’s study used telemetry for every engineer who could adopt the tool, along with data on their direct usage. That degree of visibility requires centralized observability. A governed connection to data sources can inherit permissions from source systems across tools. Tracking those permissions shows how the working context changes when teams or roles change.
Shared skill registries also help keep performance baselines comparable by preventing teams from independently rebuilding equivalent prompts and workflows. Action-level audit logs record what was invoked, by whom and against which data. Those records let a quality decline be traced to a specific tool, context or workflow change. Scoped access for each team helps keep comparisons tied to differences in the work.
Instrumented MCP-based infrastructure can connect these needs by logging tool calls with session identity, user, server and invocation detail. Productivity telemetry and access auditing can then use the same record. By contrast, ungoverned Shadow AI leaves teams unable to distinguish a performance change from an access change. The framework remains useful at scale only when its data remains comparable.
Sources
- Adoption and Impact of Command-Line AI Coding Agents: A Study of Microsoft's Early 2026 Rollout of Claude Code and GitHub Copilot CLI
- AI IDEs or Autonomous Agents? Measuring the Impact of Coding Agents on Software Development
- The Impact of LLM-Assistants on Software Developer Productivity: A Systematic Review and Mapping Study
- Intuition to Evidence: Measuring AI's True Impact on Developer Productivity