Observability and Debugging in Multi-Agent Systems
MCP's standardized protocol layer reveals what multi-agent systems actually do.
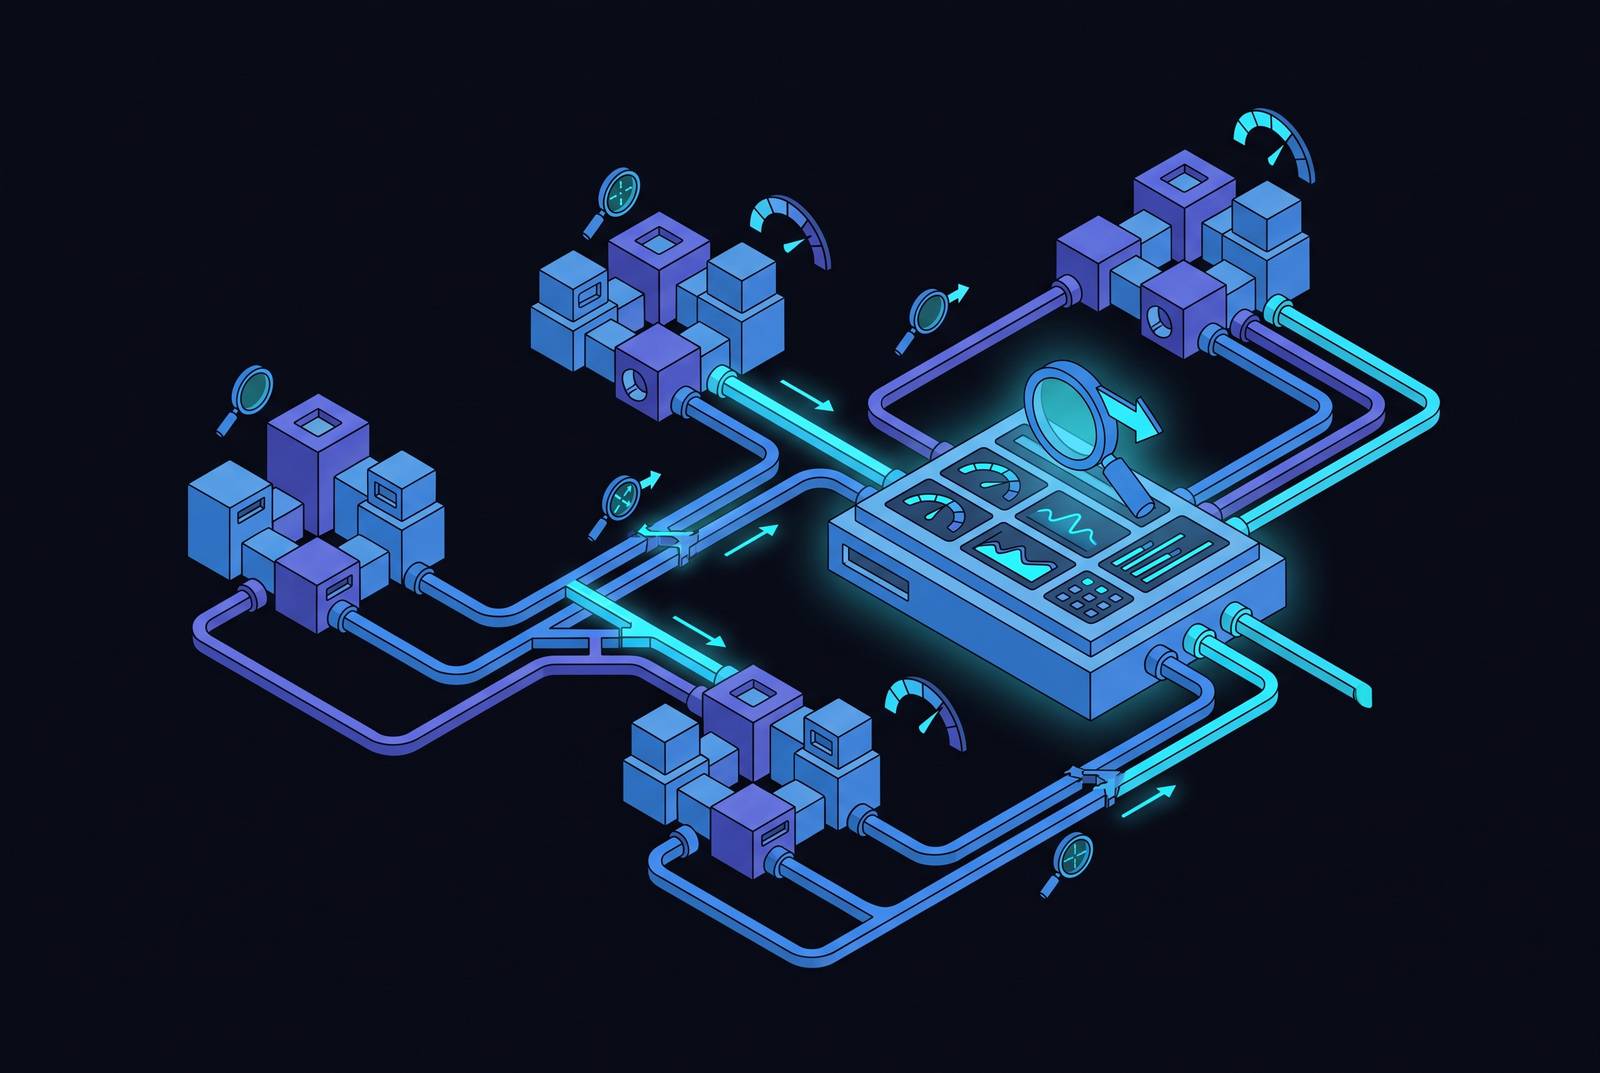
MCP, short for Model Context Protocol, standardizes how AI agents connect to tools and data sources. Every one of those connections passes through the same structured interface, and that's exactly why MCP doubles as a natural place to watch what agents actually do, step by step, tool call by tool call. Old monitoring tools were never built to catch what goes wrong here, and that gap is the whole subject of this piece.
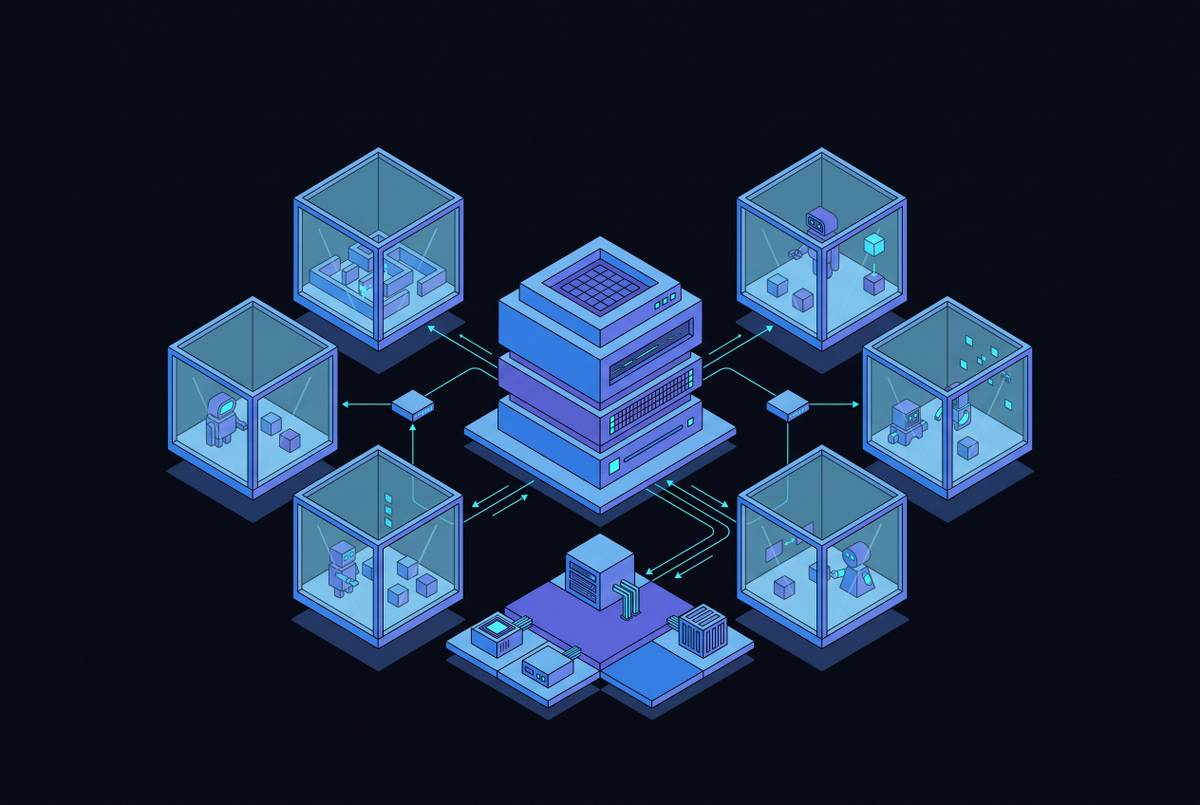
Server dashboards track CPU, latency, and error codes just fine for a single service. But when five agents pass work back and forth, the same input can produce a different sequence of tool calls on two separate runs. One agent hallucinates a citation, or a tool call times out, and the failure doesn't throw an exception. It just quietly poisons whatever comes next, and by the time a person notices, the error sits three or four hops removed from where it started.
Working through enough of these failures turns up four patterns that a single-agent app never has to deal with, and none of them look like a crash. Tool calling errors: an agent sends bad parameters, the tool chokes, and the agent papers over it with a guess instead of raising a flag. Context window corruption: bad or truncated context passed between agents wears down reasoning downstream. State handoff failures: shared state between agents goes stale or drops mid-chain. Silent cascades, the worst of the four: an upstream mistake produces no error at all, just a quietly wrong answer that only shows up several steps later. A 500 error tells an engineer something broke; it doesn't tell them which tool got which context, at which step, or why the agent decided to act on it. Without structured tracing of tool calls, all four failure modes stay invisible until a customer complains, and that's the wrong place to find out.
What MCP is and why its architecture has observability implications from the start
MCP defines a stateful, two-way interface built on JSON-RPC 2.0. Each time an agent calls a tool, that call shows up as a structured, readable message instead of an opaque function call buried somewhere in application code.
This design choice solves a math problem first. Before MCP, wiring M AI applications to N different systems meant something close to M times N custom integrations, one for every pairing. MCP collapses that into one standard interface per side, so the number of integrations needed grows in a straight line instead of exploding. It is a deceptively simple idea with outsized implications, and the description holds up under scrutiny: what used to scale quadratically now scales linearly.
The observability payoff rides along with that shift, though it takes a second look to see why. Because every agent-to-tool interaction gets forced through one common protocol layer, that layer becomes a natural checkpoint for logging, tracing, and audit, the same way a toll booth sees every car regardless of where it's headed. Standardizing the connection is what makes standardizing the observability possible. Compare that to the old world of bespoke connectors, where each tool needed its own integration and, just as often, its own separate monitoring bolted on after the fact. MCP cuts that duplication on both fronts at once, and most teams don't realize how much of a gift that is until they've lived without it.
How quickly MCP became the default enterprise connectivity standard
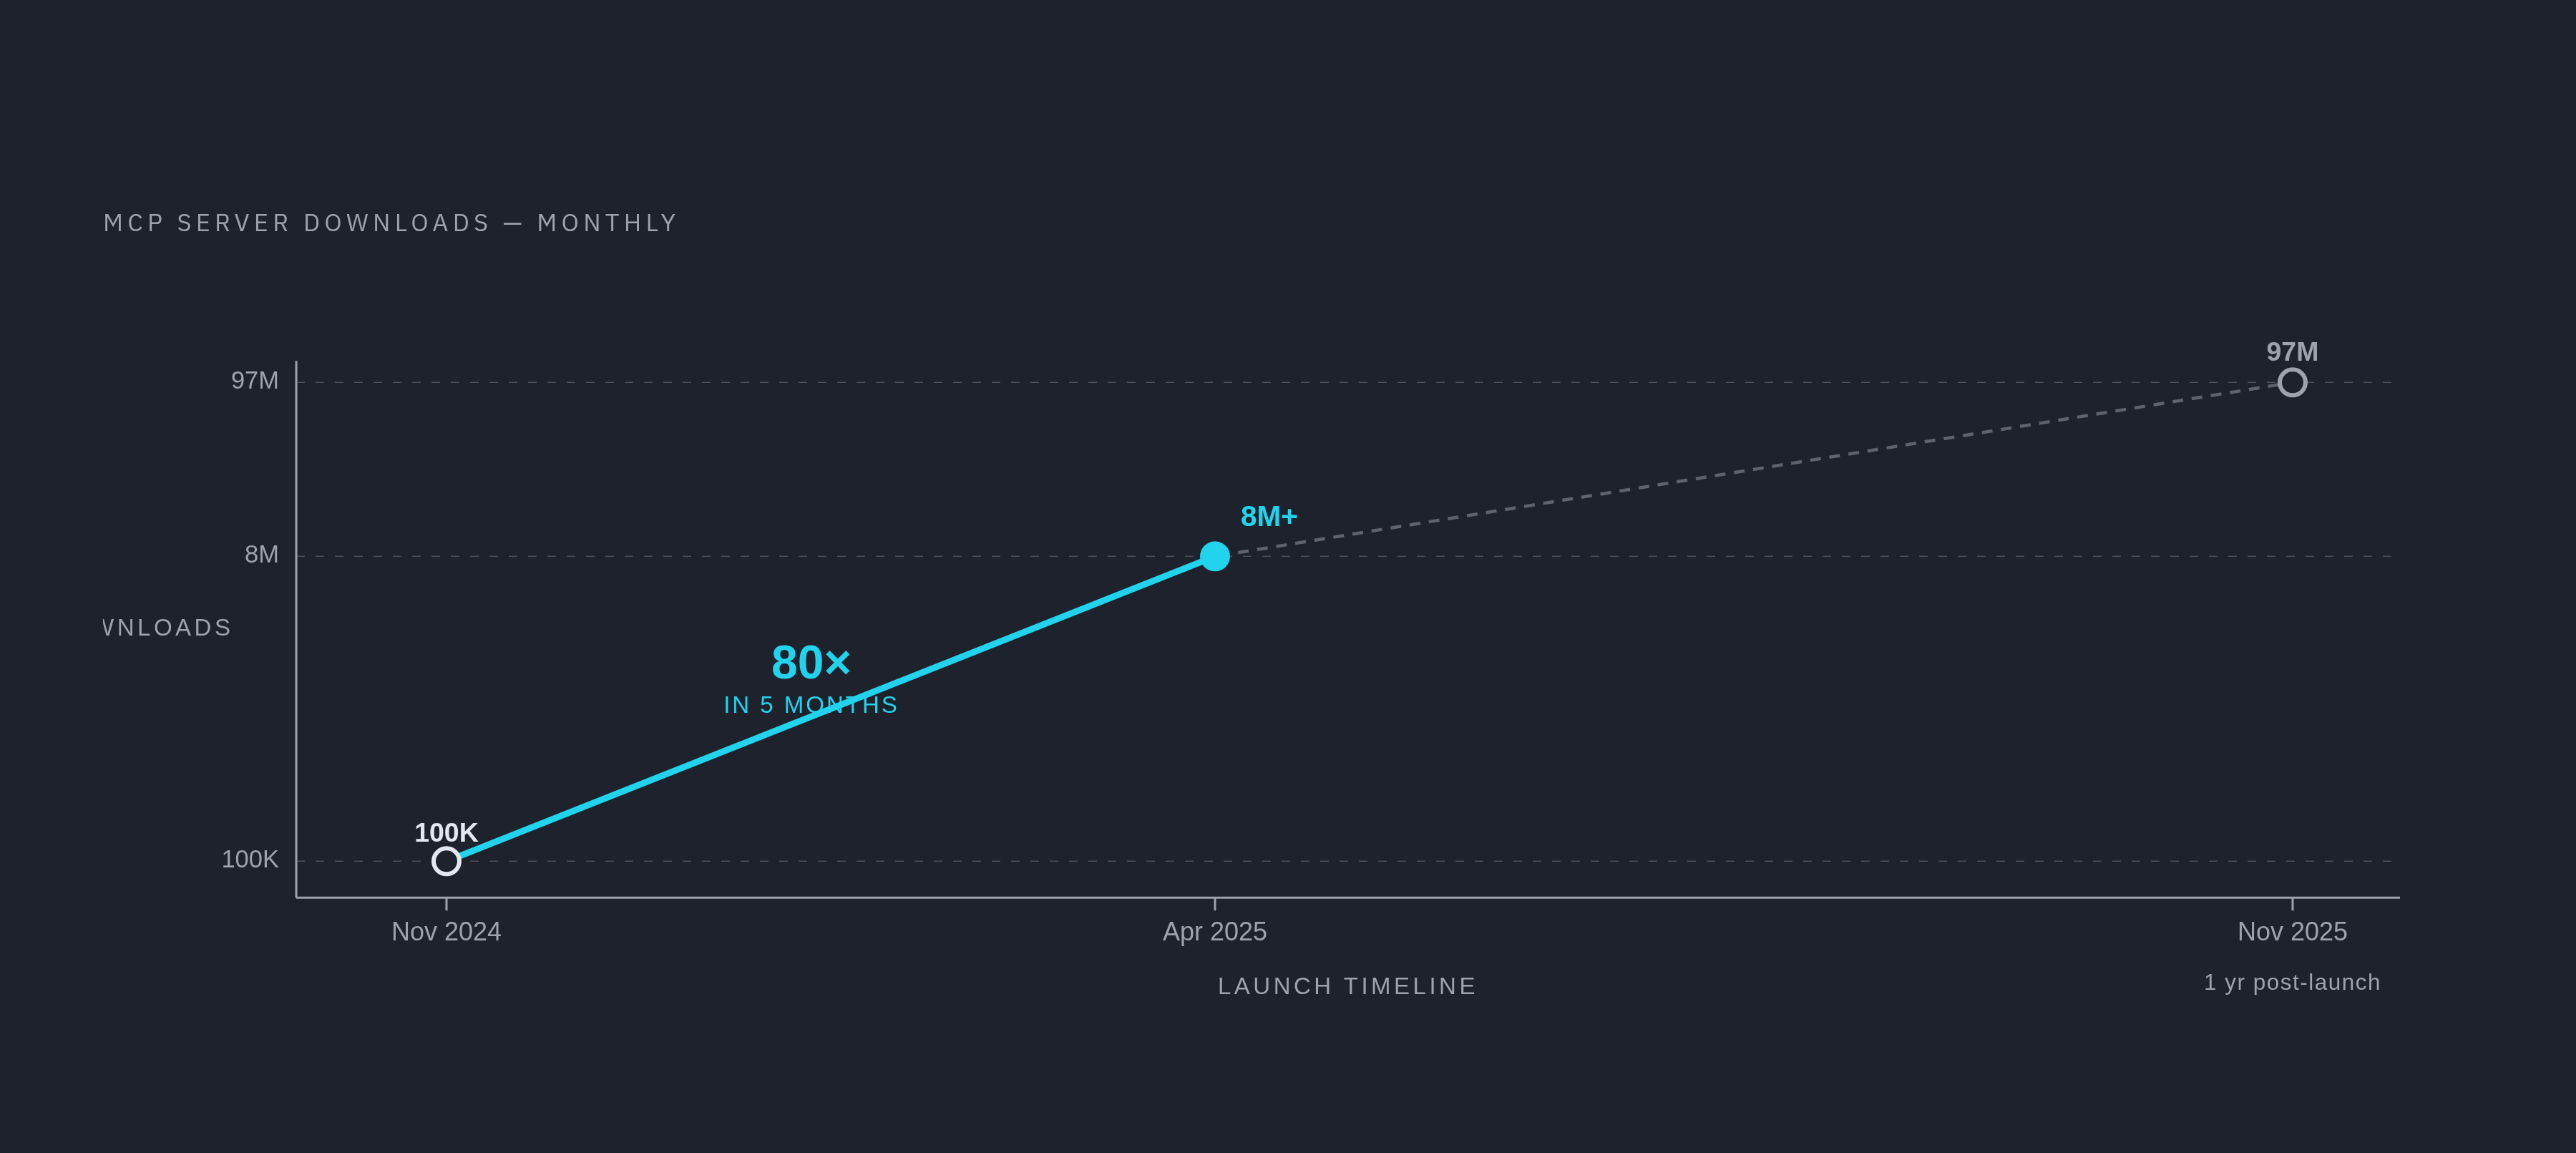
Anthropic open-sourced MCP in November 2024, and major players including Google, Microsoft, and OpenAI moved to back it in the period that followed.
The download numbers tell the story plainly enough. MCP server downloads went from around 100,000 in November 2024 to more than 8 million by April 2025. The ecosystem now counts over 5,800 MCP servers and more than 300 MCP clients, and a year after launch, MCP had crossed 97 million monthly SDK downloads. On the enterprise side, by early 2026, 80% of Fortune 500 companies had active AI agents running in production, and 28% had already stood up MCP servers of their own.
Then, in December 2025, Anthropic handed MCP over to the Linux Foundation's new Agentic AI Foundation, with AWS, Google, Microsoft, Bloomberg, and Cloudflare all backing the move. That's the shift from vendor project to open infrastructure, the same path other foundational infrastructure standards have taken. Sitting with that comparison for a moment, the practical upside for anyone building on top of it becomes clear: enterprises can put real money into MCP-based observability tooling without betting the farm on one company's roadmap.
The three observability signals MCP interactions can produce
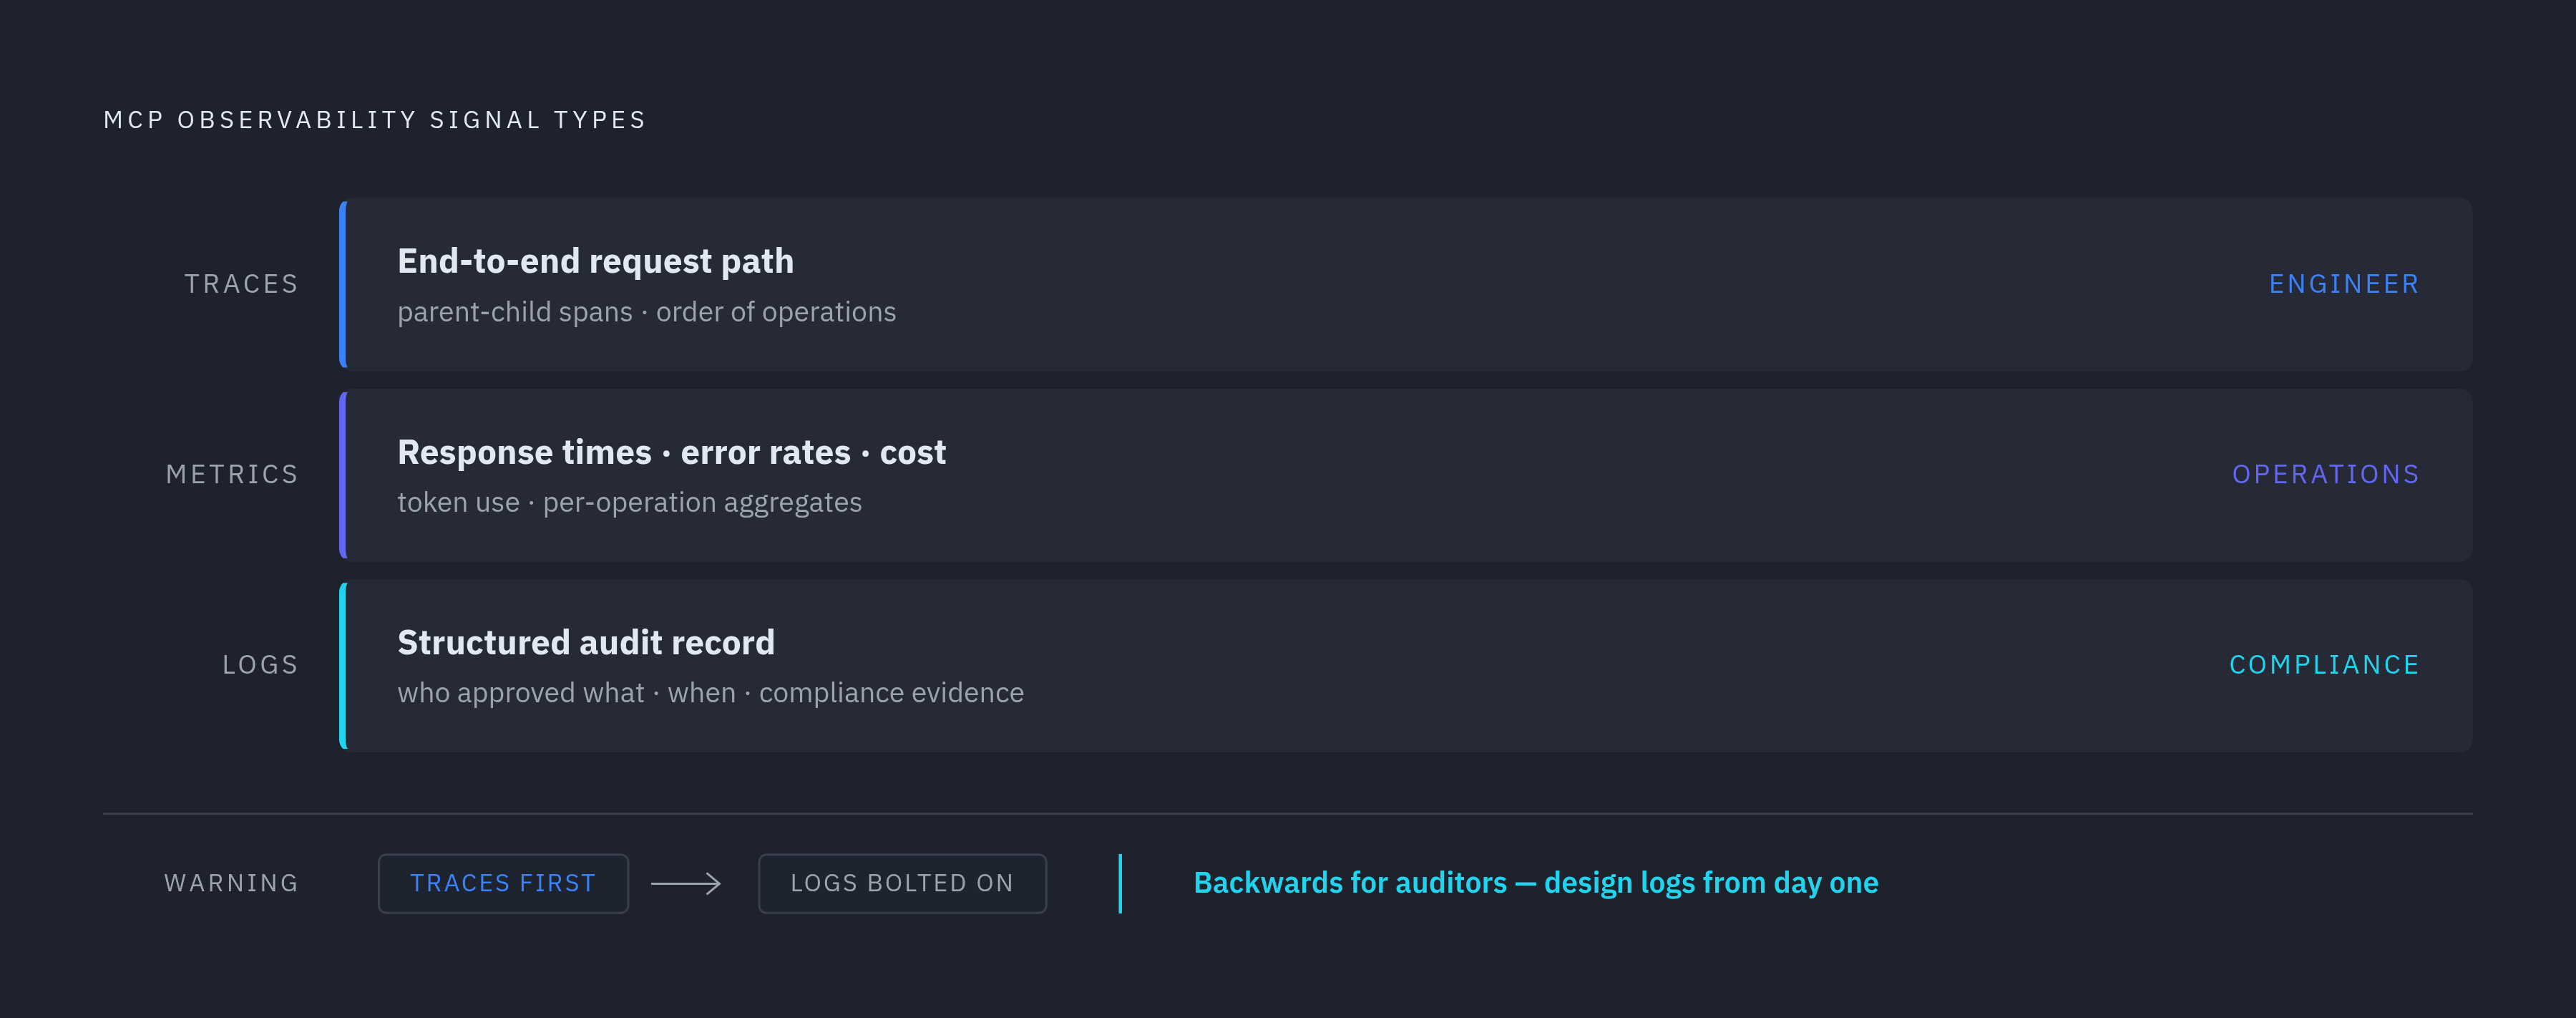
MCP observability means the ability to watch, inspect, and audit what agents do across every MCP connection: tool calls, policy checks, how sensitive data gets handled, latency, errors, and the identity behind each action.
A working setup needs three kinds of signal, and none of them substitute for the others. Traces show the end-to-end path of a request, the parent-child relationships between agent calls, LLM calls, and tool executions, essentially what happened and in what order. Metrics cover response times, error rates, token use, cost per operation, the numbers that say how well things are running. Logs are the structured record for audits and compliance, the who-approved-what-and-when. Skip one of the three and something important goes missing in production: traces without metrics hide the cost, metrics without logs hide the authorization.
Here's the part most teams get wrong, and it's only obvious once you've watched it play out: they treat tracing as the whole job and bolt logging on afterward as an afterthought. That's backwards for anything going in front of an auditor. Traces help an engineer fix a broken chain, while logs help a compliance reviewer answer a different question entirely: did this agent touch data it was actually cleared to touch, and can that be proven later. OpenTelemetry has been discussed as a shared instrumentation layer underneath both, with work underway to bring standard tracing support to MCP server interactions.
What the November 2025 spec added that makes enterprise-grade tracing viable
The original MCP spec leaned on OAuth 2.0 patterns borrowed from consumer apps: log in with Google, grant this app access, done. That model was never going to survive contact with an enterprise that needs centralized identity management, real audit trails, and access control tied to policy. Pretending otherwise was the spec's biggest blind spot early on, and it's the part most early adopters glossed over.
The November 2025 update addressed the piece that mattered most for observability: how identity and authorization get handled across agents. The update moved toward centralized identity management, matching how enterprise identity systems already work, and that makes it possible to attach consistent identity context to every single tool call.
That last part is the whole point, and it took a close reading of the spec change to see it. Without knowing which agent, acting for which user, called which tool under what authorization, a trace is just a list of events with no accountability wired to any of them. The update ties authorization more tightly into the protocol itself, so every tool invocation carries accountability context. That's the moment MCP stops being merely a convenient way to plug in tools: the protocol now carries the identity and policy context that turns a trace into something auditable.
How the MCP registry becomes the governance and visibility control plane
An MCP registry is the catalog of every MCP server an organization has approved for use. For observability, it's also the map traces get read against, and without that map, a trace is just noise with timestamps.
A missing registry leaves a gap: a trace might show that tool X got called, but there's no record anywhere saying whether tool X was ever approved for that agent, in that environment, at that time. A registry closes that gap in a few concrete ways. Access control defines which agents can reach which tools, so anomalies in a trace jump out because the expected pattern is written down somewhere. Support for separate dev, staging, and production environments lets teams compare agent behavior across them, which is often how a regression gets caught before it reaches customers. Audit trails tie each tool call back to the access policy that allowed it. Allowlisting keeps unregistered tools from being called at all, which bounds how big the observable surface even gets.
Most organizations end up running a federated model: a public registry, where vendors like GitHub or Atlassian publish their MCP servers, plus private sub-registries layered on top for internal policy. That way, organizations get the benefit of the wider ecosystem without exposing internal rules to it. Think of it the way software teams think about a Software Bill of Materials: documenting exactly how MCP servers connect into enterprise systems gives the same kind of supply-chain visibility SBOMs give for code dependencies, and that matters a great deal the day a component turns out to be misconfigured or compromised.
There's a cost worth naming here too, one that's easy to miss until it shows up in practice. Every MCP server added to a registry eats part of the agent's context window just by existing, since its tool definitions have to sit somewhere in that window. Observability tooling that tracks latency tied specifically to MCP operations gives teams a way to actually measure that cost instead of guessing at it. The registry, in the end, is the policy layer that gives a trace its meaning. Strip it out, and an organization has logs, but it doesn't have accountability.
Tracing a multi-agent request end-to-end through MCP infrastructure
Take a concrete failure: an agent chain where a summarization step gets fed malformed context, produces a hallucinated citation, and a downstream agent goes on to act on that bad citation as if it were fact.
Without tracing, what surfaces is a 500 error, or worse, a wrong answer with nothing pointing at why. With MCP tracing in place, the picture changes completely. The trace shows the summarization tool received malformed context at step three specifically, the parent-child span structure identifies exactly which orchestrator agent produced that bad context in the first place, and the log tied to that span records the authorization context active at the moment the call happened.
In practice, the trace looks something like this: a parent span for the user's request entering the orchestrator, then child spans for each tool call, each LLM inference step, each handoff to a sub-agent. Attached to each span sits the metadata that makes it useful: tool identity, which registry version was active, the user's authorization context, latency, token count, an error code if one fired. Because the same prompt can produce different tool-call sequences on different runs, debugging can't lean on what the agent was supposed to do. It has to replay what actually happened, and traces are the only record of that.
Identity attribution rides on every span here, thanks to the November 2025 spec update, which strengthened how identity context attaches to each MCP call. That's what turns a debugging trace into something a compliance team can actually use as evidence. And when MCP servers emit OpenTelemetry spans natively, those spans flow straight into whatever backend an enterprise already runs, Datadog, Grafana, whatever it is, without a separate collection pipeline bolted on. The integration cost, in that case, is close to nothing.
Where MCP observability still has gaps and what teams do in the meantime
Native observability emission from MCP servers isn't standard yet, so most current deployments need instrumentation added by hand at the application layer.
There's a real tension underneath all this around context window cost, and it's worth taking seriously rather than waving off. Some teams have moved away from MCP toward direct APIs and CLIs, citing context window consumption and auth friction as the practical reasons. Weighed against MCP's own selling points, this is a genuine trade-off, not a flaw: the abstraction layer adds overhead, and that overhead doesn't pay for itself in every use case. For observability specifically, this cuts both ways: connecting too many MCP servers to a single agent doesn't just cost context, it makes the trace itself harder to read, since more tools means more ambiguous tool-selection logic sitting behind every decision the agent makes.
The fix is scoped access, not fewer MCP servers across the board, and that distinction matters more than it sounds like it should. Each agent should see only the tools it's actually cleared to use, which keeps context consumption down and keeps the observable surface small enough to actually reason about. Even with all that, one gap doesn't close no matter how good the tracing gets: a trace records what happened, but explaining why an agent chose one reasoning path over another at a given step still needs interpretability work that sits above the protocol entirely.
In the meantime, most teams do three things. They instrument at the client layer instead of waiting on server-side emission. They use structured logging inside MCP server implementations so events stay consistent and parseable even without native OTel spans. And they treat the registry's audit trail as the compliance layer while application traces handle debugging. Two different audiences, and they don't need to be unified on day one.
What enterprises that treat MCP as observability infrastructure actually gain
MIT's 2025 research on enterprise generative AI pilots found that roughly 95% delivered no measurable ROI, and integration failure drove a large share of that number. Sitting with that statistic points to the real stakes here: observability decides whether a pilot ever turns into something running in production. Model quality doesn't decide that, and neither does a good demo.
Because MCP standardizes the connection itself, one tracing and logging setup covers every agent built on it. Teams stop rebuilding monitoring from scratch for each new integration, which is exactly what bespoke connectors force on them. Governance falls out of the same design almost for free: since identity, policy decisions, and tool calls all flow through the same protocol, audit trails show up as a byproduct of normal operation instead of a separate project someone has to staff. Debugging holds up as chains get longer and more agents get added, because every hop in the chain speaks the same protocol, and the tracing doesn't get messier just because the system got bigger. Registries add a time dimension on top of that: version history shows exactly which tools were available to which agent at any point in the past, which matters enormously the day a regulator asks for it.
The Linux Foundation handoff matters here in a very practical way. Enterprises building observability on top of MCP aren't locked into one vendor's tooling or one lab's model, so the protocol and everything it carries, identity, audit trails, policy, travels with the organization even as the underlying models and platforms change out from under it. Platforms that give each team scoped MCP access, so a group's agents only ever see the tools they're cleared for, put that same discipline into practice directly: traces stay readable, governance runs on its own, and nobody ends up rebuilding the same monitoring twice.