How to Debug an MCP Server with MCP Inspector
Use Inspector to isolate protocol bugs instead of chasing ghosts through Claude's reasoning.
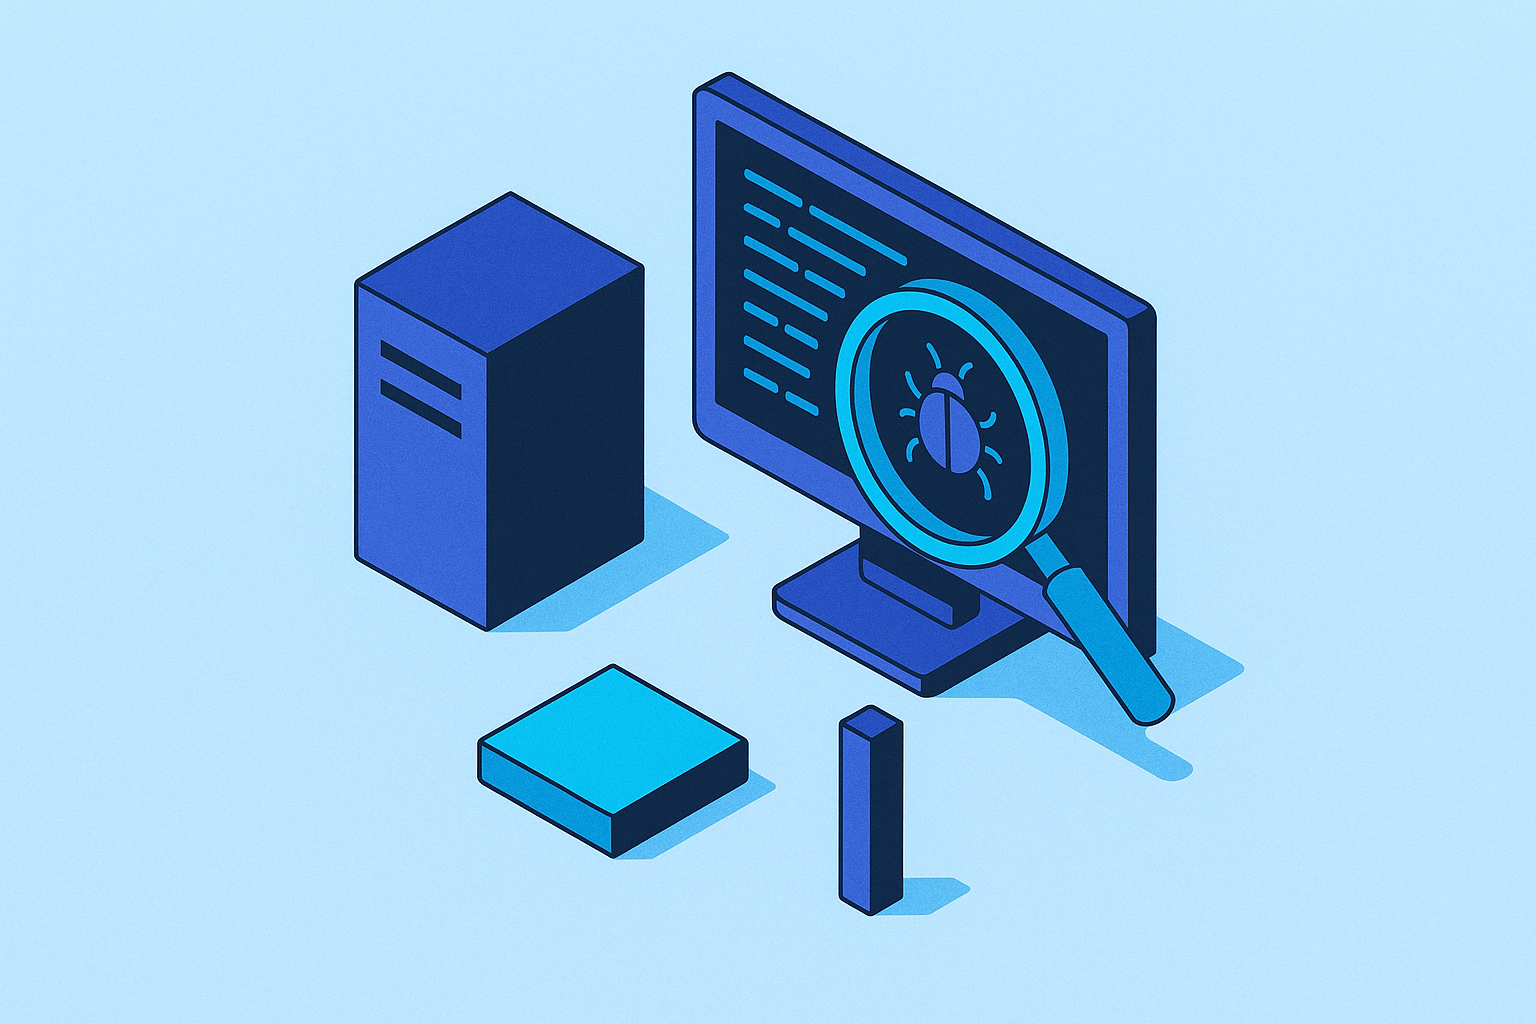
MCP Inspector is the debugging tool built for testing MCP servers. It works by putting a real client between you and your server, one that shows the raw protocol traffic instead of hiding it behind a chat window. Most developers reach for Claude Desktop first when a server misbehaves, watching the chat responses for clues. That instinct is wrong, and it wastes time: it mixes together two separate failure domains, so you end up guessing whether a bad response came from your server's code, the client's reasoning, or a mismatch in how the two sides speak the protocol. Skipping Inspector in favor of a chat client is the single most common way developers burn an afternoon chasing the wrong bug.
Inspector is the official reference tool for testing and debugging MCP servers, maintained by the Model Context Protocol team, with the code living at github.com/modelcontextprotocol/inspector. Think of it as Postman, but built for MCP: a direct line into how your server behaves, no AI client sitting in between to muddy the signal.
It's not one process. Two separate pieces run at the same time, and both matter:
- MCPI, the MCP Inspector Client, is the React-based web interface served on port 6274.
- MCPP, the MCP Proxy, is a Node.js process on port 6277 that talks MCP to your server on one side and HTTP to the browser on the other.
The port numbers aren't random. Spell MCPI and MCPP on a phone's T9 keypad and you get 6274 and 6277. Small thing, but it sticks once you know it.
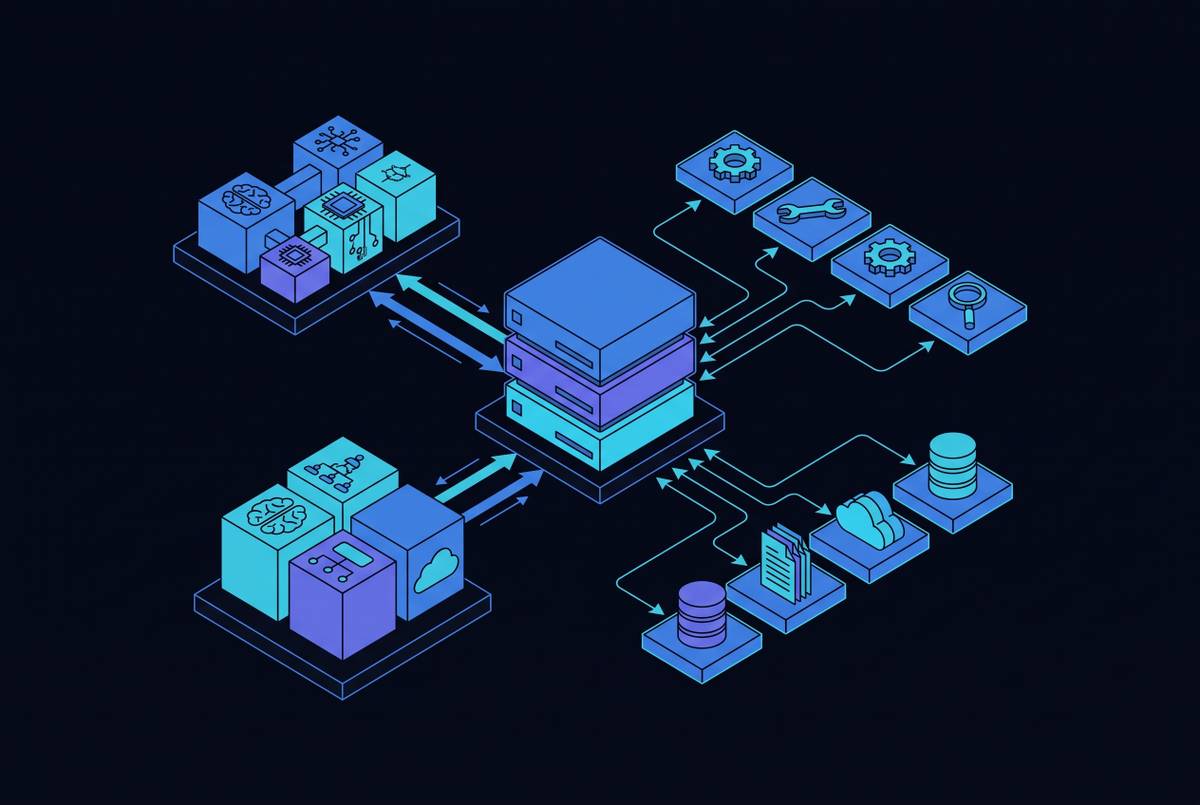
Here's the part people get backwards: Inspector is not secretly sitting between Claude and your production server, intercepting real traffic. It's its own independent MCP client. What you're watching in the UI is the conversation between the Inspector proxy and your server, a separate connection built purely for testing, nothing more. The proxy is what makes any of this possible in a browser at all. It bridges the transport gap so a browser, which can't natively speak stdio, still gets to talk to a server that only understands stdio, SSE, or streamable HTTP.
Inspector V2, released in July 2026, rebuilt the tool from the ground up. It now ships as a single package, @modelcontextprotocol/inspector, with three interfaces (Web, CLI, TUI) sitting on one shared core. The latest published version is 0.22.0 on npm as of June 4, 2026, and it needs Node.js 22.7.5 or newer. No install step required: npx pulls it down and runs it on the spot.
The three interfaces Inspector ships with and when to reach for each
All three interfaces run on the same core underneath: same transports, same config files, same OAuth state saved to disk, same protocol-version negotiation. A connection behaves the same no matter which one you're looking at it through. What changes is how much of that behavior you can see, and how automatable it is.
Web is the default, and for most people, it's where to stay, full stop. Run:
npx @modelcontextprotocol/inspectorand you get the full graphical inspector at localhost:6274. Start here if you're new to the tool: initial development, poking through schemas, calling tools by hand, watching protocol messages scroll by in real time.
CLI trades the browser for scriptability:
npx @modelcontextprotocol/inspector --cliNo graphics, just structured output you can pipe, grep, or check into a CI pipeline. It exposes MCP methods directly on the command line, things like tools/list, tools/call, resources/list, prompts/list, so a build pipeline or a pre-commit hook can call your server the same way a person would in the web UI.
TUI is the terminal-based middle ground, and honestly, the one most people should skip:
npx @modelcontextprotocol/inspector --tuiIt earns its keep on an SSH session into a remote box, or a headless server with no browser to open. Outside of that narrow case, reach for Web or CLI instead. There's no real reason to make TUI part of a regular workflow.
One rule to know before typing any of this: the mode flags (--web, --cli, --tui) only get recognized at the very front of the command. The first token that isn't one of those three ends Inspector's own parsing, and everything after gets forwarded straight to the client, untouched. Pass two mode flags in the same command and it stops you cold with an error. As for --help, running it bare prints the launcher's own help text; add a mode flag first and it prints that specific client's full flag reference instead.
Getting Inspector running: launch commands, transports, and environment setup
Nothing to install ahead of time. npx handles fetching and running Inspector in one step, so the commands look like this depending on what you're testing:
- A TypeScript or Node server:
npx @modelcontextprotocol/inspector node build/index.js - A Python server run through
uv:npx @modelcontextprotocol/inspector uv --directory path/to/server run package-name args... - A published npm package with no local clone needed:
npx -y @modelcontextprotocol/inspector npx @modelcontextprotocol/server-filesystem ~/Desktop - A published PyPI package:
npx @modelcontextprotocol/inspector uvx mcp-server-git --repository ~/code/mcp/servers.git - A remote HTTP server:
npx @modelcontextprotocol/inspector --server-url https://api.example.com/mcp --transport http
When Inspector starts, it prints a URL with a one-time session token baked in. Open that exact URL, not a bare localhost:6274. Typing the bare address is probably the single most common first mistake, and it leaves you staring at a connection screen asking for a token you never copied down.
Transport choice depends on where the server actually lives, and this isn't a matter of taste. STDIO is the default for anything local: Inspector spawns your server as a child process and talks to it over stdin and stdout, the simplest setup for day-to-day development. Streamable HTTP is the standard for anything deployed remotely, say a server running on a Cloudflare Worker, using HTTP POST for client-to-server messages. SSE still works, but treat it as legacy: new projects should build on Streamable HTTP, no exceptions.
Passing environment variables and arguments takes a couple of specific patterns. Use -e for env vars:
npx @modelcontextprotocol/inspector -e API_KEY=your-key -e DEBUG=true node build/index.jsAnd use -- to draw a hard line between flags meant for Inspector and flags meant for your server:
npx @modelcontextprotocol/inspector -e LOG_LEVEL=debug -- node build/index.js --port 8080For setups juggling more than one server, a config file keeps things straight:
npx @modelcontextprotocol/inspector --config path/to/config.json --server <server-name>The --server flag is mandatory when using a config file with Inspector. The server-name has to match a key in that config file exactly, something like "filesystem" or "spring-boot-ai-mongo-mcp-server". The config file uses a standard MCP server configuration schema, with named entries for each server.
Port conflicts happen, especially if something else on the machine is already sitting on 6274 or 6277. Override them with the CLIENT_PORT and SERVER_PORT environment variables before running the launch command. For testing servers of unknown or untrusted origin, running Inspector through Docker adds a layer of isolation: bind the ports to 127.0.0.1, set HOST=0.0.0.0, and set MCP_AUTO_OPEN_ENABLED=false so it doesn't try to pop open a browser automatically.
None of this replaces reading the server's own README first. Every server expects different commands, different arguments, sometimes different environment variables entirely.
Reading the web UI: what each panel shows and what to look for
Once connected, pin the monitoring sidebar so protocol traffic stays visible no matter which tab is open. Do this before anything else, before touching a single tool. It's the difference between debugging with your eyes open and debugging blind, and skipping it means missing the exact moment something goes wrong.
The server connection pane on the left holds the transport selector, the command/args/env fields, a bearer token field for remote servers, and the connect or reconnect button. It's also where the proxy session token goes if you made the classic mistake of opening bare localhost:6274 instead of the full URL Inspector printed at startup.
The Tools tab lists every tool the server exposes, along with its JSON schema and description. Input parameters get rendered as an actual form, generated straight from the schema. That matters more than it sounds like it should: a tool definition with a wrong or missing field type shows up right away as a broken or confusing form, before any language model ever gets near it. Click Run, and the response comes back inline as full JSON. Watch for clean, structured error responses on bad input, and no stack traces or secrets leaking out in the error text.
The Resources panel lists everything the server exposes as a resource, with MIME types, descriptions, and URIs attached. It lets you look at resource content directly and test subscriptions for real-time updates. If this tab shows up empty when resources should be there, the likely cause is a missing or incorrect capability declaration on the server side.
The Prompts panel lists prompt templates and their arguments. Feed it custom argument values and it shows the exact message structure that would get sent to a language model. Use it as a gut check: confirm the message actually matches what the server intends to send, before any model has a chance to misread it.
The Notifications and log panel is the live feed of everything passing between the Inspector proxy and the server: requests, responses, notifications, errors, all of it. For stdio transport, the server's stderr output shows up here too, which is exactly where startup errors and unhandled exceptions surface first. Worth flagging: as of protocol version 2026-07-28, the older Logging feature built on notifications/message is deprecated. Server logging is expected to go through stderr for stdio transport, or through OpenTelemetry for any transport. This panel is the fastest way to confirm a server is actually sending the signals it's supposed to send, instead of guessing based on how a client behaves downstream.
The repeatable debugging loop: from first connect to edge-case testing
Step 1: confirm connectivity and the initialize handshake. Watch what happens the moment a connection attempt starts. The handshake behavior may differ depending on which protocol version the server speaks. If the connection fails right here, the problem sits with initialization or the transport, not with any individual tool. Check the Notifications pane for stderr output before touching a single tool call. Figuring out whether an error comes from your server or from the Inspector proxy itself is half the actual debugging work.
Step 2: read the capability negotiation. Right after a successful connection, client and server exchange capabilities. If a tab like Resources or Prompts shows up empty or missing entirely, the server isn't declaring that capability, and the fix belongs in the server's capability advertisement, not anywhere in Inspector. Confirm every tab you expect to see is actually present before moving on to calling tools.
Step 3: call tools with valid input. Open the Tools tab, pick a tool, fill out the generated form with parameters that should work, and run it. Check that the result matches what the schema promises, and check the response for anything it shouldn't be exposing.
Step 4: deliberately break things. This is the step people skip, and it's the one that matters most. Send input types that don't match the schema. Leave out a required field and confirm the server responds with a proper MCP error instead of crashing or dumping a stack trace. Test the Prompts panel with missing arguments. If the server supports concurrent operations, fire off a few at once and see what happens. Every error path should come back as a clean, structured MCP error, and none of them should leak internals.
Step 5: keep an eye on Notifications the whole time. Confirm progress notifications show up when they're supposed to. Confirm resource change notifications fire correctly when a subscription updates. Compare the log output run over run to catch regressions before they turn into bigger problems.
For the day-to-day loop, start Inspector once and reconnect after each server rebuild, rather than killing and restarting the whole process every time. It's faster, and it keeps the Notifications history intact so runs can be compared side by side. Worth remembering too: behavior across tabs shifts between the legacy protocol era (2025-11-25 and earlier) and the modern one (2026-07-28), so know which era a given server actually speaks before assuming a tab's behavior is a bug.
Using CLI mode to catch broken servers before they reach users
CLI mode takes everything covered above and makes it scriptable. The basic call looks like:
npx @modelcontextprotocol/inspector --cli node build/index.jsFrom there, MCP methods get exposed directly as command-line options, for example --method tools/list to pull back every tool the server exposes, formatted as structured output rather than something meant for a browser tab.
That structure is exactly what makes CLI mode worth wiring into a CI pipeline or a pre-commit hook. Skipping this step and shipping straight from manual web-UI checks is how broken servers reach production. A broken tool schema, a missing capability declaration, a prompt template returning the wrong message shape: all of it gets caught automatically, before a broken server ever reaches a real user or a live AI client. Most "server bugs" turn out to be a schema typo or an undeclared capability anyway, and catching that in an automated check, before deployment, costs far less than catching it after a user hits it in production.